- Aug 5, 2013
- 2,732
- 2,439
- AFL Club
- Adelaide
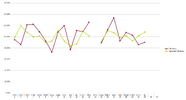
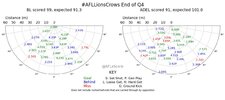
I manually collected all the crows games from the AFLxScore twitter account:
(This excludes rushed behinds)

Basically, Adelaide kick very slightly above expectations. While their opponents average almost dead-on expectations, which is to be expected and can't really be changed by anything Adelaide do.
If you can see any pattern beyond this, then you're better than me.
edit: fixed backwards Bulldogs game
(This excludes rushed behinds)
Round | Opponent | Home | WIN | Actual Score* | Expected Score | Efficiency | Opponent Score* | Opponent Expected | Opponent Efficiency | Ratio |
1 | GWS | FALSE | LOSS | 90 | 95.1 | 94.64% | 104 | 105.5 | 98.58% | 0.96 |
2 | RICH | TRUE | LOSS | 74 | 85.9 | 86.15% | 107 | 89.5 | 119.55% | 0.72 |
3 | PORT | FALSE | WIN | 117 | 96.6 | 121.12% | 86 | 79.8 | 107.77% | 1.12 |
4 | FRE | TRUE | WIN | 110 | 90 | 122.22% | 69 | 69.1 | 99.86% | 1.22 |
5 | CARL | TRUE | WIN | 118 | 108.5 | 108.76% | 59 | 58.5 | 100.85% | 1.08 |
6 | HAW | FALSE | WIN | 76 | 82.3 | 92.35% | 75 | 83.9 | 89.39% | 1.03 |
7 | COLL | TRUE | LOSS | 55 | 75.8 | 72.56% | 55 | 59.7 | 92.13% | 0.79 |
8 | GEEL | FALSE | LOSS | 71 | 65.5 | 108.40% | 96 | 86.3 | 111.24% | 0.97 |
9 | STK | TRUE | WIN | 121 | 101.1 | 119.68% | 69 | 75 | 92.00% | 1.30 |
10 | WB | FALSE | LOSS | 40 | 52 | 76.92% | 85 | 102 | 83.33% | 0.92 |
11 | BL | TRUE | WIN | 94 | 84.6 | 111.11% | 74 | 84.9 | 87.16% | 1.27 |
12 | GCFC | FALSE | LOSS | 87 | 79.9 | 108.89% | 107 | 97.2 | 110.08% | 0.99 |
13 | WCE | TRUE | WIN | 174 | 138.2 | 125.90% | 52 | 51.5 | 100.97% | 1.25 |
14 | BYE | | | | | | | | | |
15 | COLL | FALSE | LOSS | 77 | 86.3 | 89.22% | 80 | 87.5 | 91.43% | 0.98 |
16 | NMFC | TRUE | WIN | 138 | 122.7 | 112.47% | 72 | 65 | 110.77% | 1.02 |
17 | ESS | FALSE | LOSS | 95 | 71 | 133.80% | 110 | 102.7 | 107.11% | 1.25 |
18 | GWS | TRUE | LOSS | 57 | 61.5 | 92.68% | 68 | 69 | 98.55% | 0.94 |
19 | MELB | FALSE | LOSS | 92 | 85.5 | 107.60% | 97 | 95.9 | 101.15% | 1.06 |
20 | PORT | TRUE | WIN | 112 | 109 | 102.75% | 64 | 69 | 92.75% | 1.11 |
21 | GCFC | TRUE | WIN | 89 | 103.7 | 85.82% | 60 | 59 | 101.69% | 0.84 |
22 | BL | FALSE | LOSS | 91 | 101 | 90.10% | 99 | 91.6 | 108.08% | 0.83 |
23 | | | | | | | | | | |
24 | | | | | | | | | | |
TOTAL | --- | --- | | 1978 | 1896.2 | 104.31% | 1688 | 1682.6 | 100.32% | 1.04 |

Basically, Adelaide kick very slightly above expectations. While their opponents average almost dead-on expectations, which is to be expected and can't really be changed by anything Adelaide do.
If you can see any pattern beyond this, then you're better than me.
edit: fixed backwards Bulldogs game
Last edited:


