Stats observations

Remove this Banner Ad

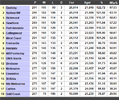
Just found by accident that 2 of the 4 lowest team clearance counts in a single game!

Melbourne v Fremantle, Rd1 1998 just 15.
Fremantle v Melbourne, Rd1 1998 just 5.

Surely that can't be right? Maybe they counted them differently

In a similar vein, the two lowest possession counts ever recorded are from this North Melbourne vs South Melbourne game in round 1, 1965:


I was thinking there might have been some difference with how stats were recorded in those early days, and that's a possibility given that 20 of the 40 lowest possession counts appeared in the 1965 and 1966 seasons, but that might also just be a function of the game being played differently in those days. But it's still difficult to account for the fact that North managed a full 30 possessions less than any team in history during a game in which their opponents collected what would otherwise have been the lowest possession count in history in its own right.

I tried to find some info on the game, and the records suggest that it was played in wet weather, but otherwise no other mention of anything unusual. Incredibly, Bob Skilton recorded 37 possessions in this game, meaning that he was responsible for about 11% of the total possessions recorded by both teams, which itself must be a record.
 
Was perusing AFL Tables, and checked Mitch Duncan's career stats, as i had been following his win tally, with Geelong's win over the Lions notching his 200th victory.

But i am quite staggered that in a 279 game career, he's played 26 games against Hawthorn, but if he plays the Blues this weekend, it will be just his 12th game against them. For such a long career, that's quite a discreptancy! Aside from players on Derby sides, doubt too many others would have numbers like that differential.
 

Log in to remove this ad.

Was perusing AFL Tables, and checked Mitch Duncan's career stats, as i had been following his win tally, with Geelong's win over the Lions notching his 200th victory.

But i am quite staggered that in a 279 game career, he's played 26 games against Hawthorn, but if he plays the Blues this weekend, it will be just his 12th game against them. For such a long career, that's quite a discreptancy! Aside from players on Derby sides, doubt too many others would have numbers like that differential.


amazing numbers and amazing win rate.

goes to show the uneveness in the fixturing.

no doubt geelong and hawthorn have plated each other twice a year on a number of occasions since the renewed rivalry after 2008. they would've also met in finals a few times as well, whereas carlton haven't been around finals for a while.

perhaps he also missed the odd game or 2 v carlton thru injury when fixtured against them.
 
In a similar vein, the two lowest possession counts ever recorded are from this North Melbourne vs South Melbourne game in round 1, 1965:


I was thinking there might have been some difference with how stats were recorded in those early days, and that's a possibility given that 20 of the 40 lowest possession counts appeared in the 1965 and 1966 seasons, but that might also just be a function of the game being played differently in those days. But it's still difficult to account for the fact that North managed a full 30 possessions less than any team in history during a game in which their opponents collected what would otherwise have been the lowest possession count in history in its own right.

I tried to find some info on the game, and the records suggest that it was played in wet weather, but otherwise no other mention of anything unusual. Incredibly, Bob Skilton recorded 37 possessions in this game, meaning that he was responsible for about 11% of the total possessions recorded by both teams, which itself must be a record.

Almost certainly the methodology changed. I'm curious as to where AFL Tables etc. sourced their pre-1999 data (1999 being the year that Champion Data came on board).

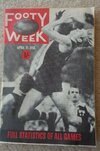
I'm guessing the 1965 era stuff came from Footy Week. This particular issue below would probably contain the answer.

Footy Week.jpg

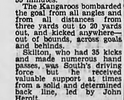
Interestingly, the Age report from the following day claims that Skilton had 35 kicks, so maybe they had their own statisticians? Or perhaps they were counting kick-ins from behinds...

Screenshot 2024-04-25 23.35.40.png
 
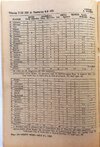
I managed to find an example of how a stats sheet looked in Footy Week during 1965. This is from the Round 13 game between Fitzroy and Footscray.

FW Stats.jpg

The numbers match up with what's on AFL Tables, which is no surprise. But what's fascinating to me is the data that's been left behind – stuff like kicking efficiency, handball efficiency, location of free kicks, stoppage counts, and entirely missed shots on goal.

To be fair, AFL Tables doesn't display any of those stats even for 2024 games, but it would certainly all be being kept by Champion Data, and all stored somewhere.

I love the little stories it tells though. Like how the Dogs received 20 free kicks inside half-forward but only managed 6 goals. Or how Ted Whitten had 18 disposals at 100% efficiency by hand and foot. Or you might think that Wayne Eastman was one of the best on ground given his 20 kicks, but only 40% of his kicks were effective.

This is stuff that needs to be kept and treasured.
 
Chris Scott now has seven actual runs of seven wins in a row (and if I can channel Rogers results here) it would be 24 times of seven wins in a row when you factor in the 13 games he started with, the 16 in a row in the 2022 Flag run, and two runs of 8 in a row.

So it's three actual 7's in a row including today's, two 8 in a row which is 2 x 2 runs of 7, seven 7's in a row for the 13-0 start in 2011, and 10 7's in a row for the 16 in a row in 2022.

Wouldn't be too many other coaches who could claim that sort of success with winning runs of seven or more?
 
Last edited:
Bailey Scott now has the 5th worst win/loss percentage for any player (who's played min 50 games) in VFL/AFL history (worst since WW2).
 
Last edited:
In a similar vein, the two lowest possession counts ever recorded are from this North Melbourne vs South Melbourne game in round 1, 1965:


I was thinking there might have been some difference with how stats were recorded in those early days, and that's a possibility given that 20 of the 40 lowest possession counts appeared in the 1965 and 1966 seasons, but that might also just be a function of the game being played differently in those days. But it's still difficult to account for the fact that North managed a full 30 possessions less than any team in history during a game in which their opponents collected what would otherwise have been the lowest possession count in history in its own right.

I tried to find some info on the game, and the records suggest that it was played in wet weather, but otherwise no other mention of anything unusual. Incredibly, Bob Skilton recorded 37 possessions in this game, meaning that he was responsible for about 11% of the total possessions recorded by both teams, which itself must be a record.
It’s possible that the game was unusually short given the very wet conditions. 47 points was the highest score of six games that extremely wet Easter Monday, yet for a full round since 1920 there has never been a lower highest score than 65 points. The disposal totals for the MCG game the same day are only slightly higher, which adds support to my conclusion, although the infamous Kardinia Park game where only one behind was scored in the first quarter and Geelong kicked its lowest winning score since 1902 had more “normal” disposal totals. I wonder if this is due to differences in style — news reports of the Kardinia Park game did say Footscray tried to maintain a lead with a possession game in the last quarter.
 
Premiers to wooden spoon:
Bambill (Millewa FL) — 2016-2017 (coming off a threepeat)
Barossa District (Barossa Light & Gawler FL) — 2013-2014
Benambra (Omeo District FL) — 1994-1995, 2000-2001
Calingiri (Mortlock FL) — 2015-2016
Cobdogla (Riverland Independent FL) — 2001-2002
Cudgewa (Upper Murray FL) — 2000-2001
Donald (North Central FL) — 2006-2007
Esperance (Esperance DFL) — 2001-2002
Federals (Upper Murray FL) — 2007-2008
Hamley Bridge (Adelaide Plains FL) — 2014-2015
Jamestown/Peterborough (Northern Areas FA) — 2004-2005 (four spoons in a row after back-to-back premierships)
Loxton North (Riverland FL A Grade) — 2004-2005
Millicent (Western Border FL) — 2018-2019
Mullewa (Great Northern FL) — 2017-2018 (four spoons in a row)
Newcomb (Bellarine FL) — 2007-2008 (did not finish above second last until 2019)
Newtown/Condingup (Esperance DFL) — 2022-2023
Orbost (East Gippsland FL) — 1996-1997
Portarlington (Bellarine FL) — 1994-1995
Ports (Esperance DFL) — 2019-2020
Renmark (Riverland FL A Grade) — 2009-2010
Southern Flinders (Northern Areas FA) — 2013-2014
Wisanger (Kangaroo Island FL) — 2005-2006 (four spoons in a row)

The Northern Areas FA 2013-2014 and Mortlock FL 2015-2016 seasons are the only ones I've found in recent times where the premiers and wooden spooners switched places.
That actually happened in the SANFL in 1934 and 1935. There is, apart from Glenelg in those two seasons, only one other case of a club falling from a premiership to a wooden spoon in the V/AFL, SANFL or WA(N)FL, and that was Subiaco as far back as 1915 and 1916, a period of course affected by World War One. It also happened to Oakleigh in the VFA in 1931 and 1932, and again financial issues were undoubtedly a factor, as the club was struggling to pay its players and lost several key personnel before the 1932 season at the height of the Depression.
 
I can't remember who talked about prime numbers here to inspire this but:

  • There have been 69 prime number games in the AFL. A "prime number game" is one where the scoreboard is entirely prime numbers.
  • The first one was Fitzroy 5.13.43 drew South Melbourne 5.13.43 in Round 7, 1897.
  • The most recent one was Sydney 13.11.89 def by Brisbane 17.11.113 in Round 7, 2022.
  • The only Grand Final was in 1990: Collingwood 13.11.89 def Essendon 5.11.41. Two other finals have been prime number games: The semi final between Geelong and St. Kilda in 1968, and the qualifying final between Essendon and Richmond in 2001
  • The lowest achievable prime number score is 2.5.17, but the lowest achieved in a prime number game has been 3.5.23 and 2.11.23 on five occasions.
  • The highest score in a prime number game was Geelong's 37.11.233 to Melbourne's 7.5.47 in Round 19, 2011. The next highest is merely 23.13.151, achieved three times.
  • Six prime number games were draws: Fitzroy vs South Mebourne in 1897, North Melbourne vs Fitzroy in 1933, North Melbourne vs Geelong in 1961, North Melbourne vs Hawthorn in 1985, Carlton vs Essendon in 2011, and Gold Coast vs Essendon in 2020.
  • Round 11, 1985 was the only time in history where there were multiple prime number games. North Melbourne drew Hawthorn and Essendon defeated Sydney. Unfortunately, they were on different days, so no two prime number games have been on the same day.
  • The longest wait between prime number games was ten years, between 1933 and 1943.
A "round prime number game" means the round is also a prime number. This has happened 31 times.

A "true prime number game" means that not only are the scores and round prime numbers, but even the day, month and year are prime numbers. This has not happened, but 2 out of 3 components of the date were prime on three occasions:

13/7/1929, Round 11: Hawthorn 5.13.43 def by Melbourne 7.11.53 — Unfortunately, 1929 is a product of 3 and 643.
27/5/1933, Round 5: St Kilda 13.19.97 def North Melbourne 11.17.83 — Unfortunately, 27 is a product of 3 and 9.
13/5/1961, Round 5, North Melbourne 11.17.83 def Carlton 17.7.109 — Unfortunately, 1961 is a product of 37 and 53.

Don't expect any true ones this year.
One other numerical thing I have noted but not discussed is game scores that are best rational approximations of irrational numbers.

The fraction 99/70 is well known as a best rational approximation of the square root of 2. There have been nine “root 2 games”:

31933Melbourne4.1 (25)7.4 (46)11.6 (72)15.9 (99)Essendon2.3 (15)5.4 (34)7.8 (50)10.10 (70)
151938South Melbourne3.3 (21)5.10 (40)5.12 (42)9.16 (70)Melbourne5.5 (35)7.6 (48)10.11 (71)14.15 (99)
161966Carlton6.5 (41)9.8 (62)12.13 (85)14.15 (99)Melbourne1.0 (6)7.3 (45)7.7 (49)10.10 (70)
81978Richmond1.4 (10)2.8 (20)5.11 (41)9.16 (70)Hawthorn2.6 (18)6.9 (45)11.13 (79)14.15 (99)
31994Carlton3.1 (19)9.6 (60)13.12 (90)14.15 (99)Geelong2.4 (16)5.6 (36)6.7 (43)10.10 (70)
51997Essendon1.2 (8)2.5 (17)6.7 (43)10.10 (70)Collingwood3.9 (27)6.12 (48)8.14 (62)14.15 (99)
162002North Melbourne4.3 (27)7.6 (48)11.9 (75)14.15 (99)Port Adelaide2.4 (16)4.7 (31)10.10 (70)10.10 (70)
182018Essendon2.5 (17)4.11 (35)9.16 (70)14.15 (99)Fremantle4.0 (24)7.1 (43)10.4 (64)11.4 (70)
32022Melbourne3.5 (23)4.8 (32)9.12 (66)14.15 (99)Essendon0.4 (4)3.5 (23)8.5 (53)10.10 (70)
The fraction 97/56, similarly to the above, is sometimes used to approximate the square root of 3. There have been four “root 3 games”:
131977Collingwood2.7 (19)5.12 (42)9.16 (70)13.19 (97)North Melbourne3.2 (20)4.4 (28)5.4 (34)8.8 (56)
31983Fitzroy1.3 (9)6.9 (45)8.11 (59)14.13 (97)Essendon2.7 (19)5.7 (37)6.12 (48)7.14 (56)
141995Hawthorn1.3 (9)4.4 (28)6.7 (43)8.8 (56)West Coast2.4 (16)8.6 (54)11.10 (76)14.13 (97)
212009Collingwood2.3 (15)5.9 (39)10.13 (73)13.19 (97)Sydney0.4 (4)4.6 (30)6.7 (43)8.8 (56)
(It’s interesting that the first ever “root 3 game” would be a preview of the Grand Final!)

The fraction 161/72 is sometimes used for the square root of 5, but there has never been a VFL or AFL game with a final score of 161 to 72. The same is true for the fractions 218/89 and the less precise 49/20 for the square root of 6, and even multiples of the ratio 49:20 have not occurred although I thought that there must have been a game with a 98 to 40 score but I did not find one.

The rational approximation 127/48 for the square root of 7 has also never occurred as a VFL or AFL game score, nor has 199/60, which is very close to the square root of 11. However, there have been two “root 10 games” with a score of 117 to 37, both involving Hawthorn:
141976Footscray0.0 (0)2.2 (14)3.3 (21)5.7 (37)Hawthorn5.4 (34)9.6 (60)16.14 (110)17.15 (117)
151980Hawthorn1.5 (11)2.7 (19)3.8 (26)4.13 (37)Geelong6.4 (40)7.7 (49)14.14 (98)17.15 (117)
The rational approximate 63/50 for the cube root of 2 has occurred once, whilst its multiple 126/100 has occurred twice, for three “cube root of 2 games”:
121918St. Kilda4.3 (27)7.6 (48)8.8 (56)9.9 (63)Collingwood2.4 (16)4.6 (30)5.12 (42)6.14 (50)
41977Richmond4.3 (27)7.4 (46)12.9 (81)14.16 (100)Collingwood4.7 (31)9.11 (65)14.17 (101)17.24 (126)
22016Fremantle4.4 (28)6.7 (43)11.10 (76)14.16 (100)Gold Coast4.3 (27)11.6 (72)16.9 (105)19.12 (126)
The rational approximation 75/52 for the cube root of 3 has also occurred once, in Round 10 of 1953 when Fitzroy 11.9 defeated St. Kilda 7.10, whilst no score of 150 to 104 has ever occurred. The rational approximation 100/63 for the cube root of 4 has occurred six times:
21930Melbourne5.4 (34)7.9 (51)13.13 (91)14.16 (100)Geelong0.0 (0)3.7 (25)3.11 (29)8.15 (63)
101957Collingwood4.0 (24)10.4 (64)12.7 (79)14.16 (100)Carlton4.2 (26)4.5 (29)9.8 (62)9.9 (63)
171973Hawthorn4.2 (26)10.5 (65)14.7 (91)15.10 (100)Fitzroy2.1 (13)6.5 (41)7.7 (49)9.9 (63)
102004West Coast4.2 (26)5.6 (36)12.10 (82)14.16 (100)Richmond3.3 (21)5.6 (36)7.6 (48)9.9 (63)
92010Sydney3.2 (20)5.4 (34)8.5 (53)9.9 (63)Fremantle3.6 (24)9.12 (66)11.14 (80)14.16 (100)
232016North Melbourne3.1 (19)5.3 (33)6.8 (44)9.9 (63)Greater Western Sydney2.5 (17)6.8 (44)10.11 (71)14.16 (100)
The rational approximation 171/100 for the cube root of 5 has never occurred, nor has the rational approximation 193/71 for e. The approximation 71/123 for γ has occurred twice:
111948Footscray4.3 (27)6.5 (41)8.8 (56)10.11 (71)Collingwood3.2 (20)11.5 (71)13.7 (85)19.9 (123)
102013Geelong3.2 (20)6.6 (42)9.10 (64)18.15 (123)Gold Coast3.2 (20)4.8 (32)9.10 (64)10.11 (71)
The approximation 22/7 for π is the best-known rational approximation of an irrational number. It has never occurred as a “lowest-term” score, but multiples have occurred twice, including one of the most remarkable games ever played, with which those into statistics are bound to be familiar:
21909Fitzroy3.5 (23)4.7 (31)7.14 (56)12.16 (88)Geelong1.2 (8)2.7 (19)3.9 (27)3.10 (28)
131983Fitzroy8.4 (52)13.8 (86)24.11 (155)34.16 (220)North Melbourne2.2 (14)8.3 (51)10.5 (65)10.10 (70)
This unusual topic came to my attention when I realised that commonly used rational approximations for irrational numbers almost always use numbers that are typical scores in football games, so that it is highly plausible that they could occur as a match score.
 
Last edited:

(Log in to remove this ad.)

Tiger fans won't be particularly impressed by this statistic for obvious reasons, but the 91-point margin in last night's 19.19-133 to 6.6-42 thrashing of Richmond by the Western Bulldogs was the second highest ever in a symmetrical game, second only to the 98-points in Geelong's massive 25.25.175 to 11.11-77 victory over Fitzroy at Kardinia Park in Round 6 1992. Next highest is 77-points, and this was the Sydney Swans 21.21-147 to 10.10-70 demolition of Fitzroy at Princes Park in Round 8 1991.

The Bulldogs and Tigers also hold another interesting second place record, and this is for the match aggregate of a drawn game, an amazing shoot-out at the Docklands which finished Richmond 20.10-130 to Bulldogs 19.16-130, behind only a draw between Essendon and Carlton early in 1993 that finished with the Bombers and Blues deadlocked at 132 points each. What is even more remarkable is that the high-scoring stalemate between the Dogs and Tigers was not played in 1978, 1988 or 1998, but in 2008 when scoring rates per match were beginning to decline from previous years. True, there were more matches back in the late 2000s and even the early 2010s that would produce results where both teams kick more than 100 points than by the late 2010s and today, but its still quite remarkable especially given century aggregate draws have always been uncommon.

Another remarkable statistic involving symmetrical games also came up this year in Gather Round, when the Brisbane Lions made short work of North Melbourne in a 16-16-112 to 6.6-42 thrashing by 70-points. While there have been other 70-point games where the difference has been 10.10, but astonishingly never a symmetrical game before. For example there has never been a game that finished 18.18-126 to 8.8-56 or 15.15-105 to 5.5-35, and even in the early years of the competition before WWI when scoring was generally much lower there are no instances of a struggling team like St Kilda or University being beaten 13.13-91 to 3.3-21.
 
One other numerical thing I have noted but not discussed is game scores that are best rational approximations of irrational numbers.

The fraction 99/70 is well known as a best rational approximation of the square root of 2. There have been nine “root 2 games”:

31933Melbourne4.1 (25)7.4 (46)11.6 (72)15.9 (99)Essendon2.3 (15)5.4 (34)7.8 (50)10.10 (70)
151938South Melbourne3.3 (21)5.10 (40)5.12 (42)9.16 (70)Melbourne5.5 (35)7.6 (48)10.11 (71)14.15 (99)
161966Carlton6.5 (41)9.8 (62)12.13 (85)14.15 (99)Melbourne1.0 (6)7.3 (45)7.7 (49)10.10 (70)
81978Richmond1.4 (10)2.8 (20)5.11 (41)9.16 (70)Hawthorn2.6 (18)6.9 (45)11.13 (79)14.15 (99)
31994Carlton3.1 (19)9.6 (60)13.12 (90)14.15 (99)Geelong2.4 (16)5.6 (36)6.7 (43)10.10 (70)
51997Essendon1.2 (8)2.5 (17)6.7 (43)10.10 (70)Collingwood3.9 (27)6.12 (48)8.14 (62)14.15 (99)
162002North Melbourne4.3 (27)7.6 (48)11.9 (75)14.15 (99)Port Adelaide2.4 (16)4.7 (31)10.10 (70)10.10 (70)
182018Essendon2.5 (17)4.11 (35)9.16 (70)14.15 (99)Fremantle4.0 (24)7.1 (43)10.4 (64)11.4 (70)
32022Melbourne3.5 (23)4.8 (32)9.12 (66)14.15 (99)Essendon0.4 (4)3.5 (23)8.5 (53)10.10 (70)
The fraction 97/56, similarly to the above, is sometimes used to approximate the square root of 3. There have been four “root 3 games”:
131977Collingwood2.7 (19)5.12 (42)9.16 (70)13.19 (97)North Melbourne3.2 (20)4.4 (28)5.4 (34)8.8 (56)
31983Fitzroy1.3 (9)6.9 (45)8.11 (59)14.13 (97)Essendon2.7 (19)5.7 (37)6.12 (48)7.14 (56)
141995Hawthorn1.3 (9)4.4 (28)6.7 (43)8.8 (56)West Coast2.4 (16)8.6 (54)11.10 (76)14.13 (97)
212009Collingwood2.3 (15)5.9 (39)10.13 (73)13.19 (97)Sydney0.4 (4)4.6 (30)6.7 (43)8.8 (56)
(It’s interesting that the first ever “root 3 game” would be a preview of the Grand Final!)

The fraction 161/72 is sometimes used for the square root of 5, but there has never been a VFL or AFL game with a final score of 161 to 72. The same is true for the fractions 218/89 and the less precise 49/20 for the square root of 6, and even multiples of the ratio 49:20 have not occurred although I thought that there must have been a game with a 98 to 40 score but I did not find one.

The rational approximation 127/48 for the square root of 7 has also never occurred as a VFL or AFL game score, nor has 199/60, which is very close to the square root of 11. However, there have been two “root 10 games” with a score of 117 to 37, both involving Hawthorn:
141976Footscray0.0 (0)2.2 (14)3.3 (21)5.7 (37)Hawthorn5.4 (34)9.6 (60)16.14 (110)17.15 (117)
151980Hawthorn1.5 (11)2.7 (19)3.8 (26)4.13 (37)Geelong6.4 (40)7.7 (49)14.14 (98)17.15 (117)
The rational approximate 63/50 for the cube root of 2 has occurred once, whilst its multiple 126/100 has occurred twice, for three “cube root of 2 games”:
121918St. Kilda4.3 (27)7.6 (48)8.8 (56)9.9 (63)Collingwood2.4 (16)4.6 (30)5.12 (42)6.14 (50)
41977Richmond4.3 (27)7.4 (46)12.9 (81)14.16 (100)Collingwood4.7 (31)9.11 (65)14.17 (101)17.24 (126)
22016Fremantle4.4 (28)6.7 (43)11.10 (76)14.16 (100)Gold Coast4.3 (27)11.6 (72)16.9 (105)19.12 (126)
The rational approximation 75/52 for the cube root of 3 has also occurred once, in Round 10 of 1953 when Fitzroy 11.9 defeated St. Kilda 7.10, whilst no score of 150 to 104 has ever occurred. The rational approximation 100/63 for the cube root of 4 has occurred six times:
21930Melbourne5.4 (34)7.9 (51)13.13 (91)14.16 (100)Geelong0.0 (0)3.7 (25)3.11 (29)8.15 (63)
101957Collingwood4.0 (24)10.4 (64)12.7 (79)14.16 (100)Carlton4.2 (26)4.5 (29)9.8 (62)9.9 (63)
171973Hawthorn4.2 (26)10.5 (65)14.7 (91)15.10 (100)Fitzroy2.1 (13)6.5 (41)7.7 (49)9.9 (63)
102004West Coast4.2 (26)5.6 (36)12.10 (82)14.16 (100)Richmond3.3 (21)5.6 (36)7.6 (48)9.9 (63)
92010Sydney3.2 (20)5.4 (34)8.5 (53)9.9 (63)Fremantle3.6 (24)9.12 (66)11.14 (80)14.16 (100)
232016North Melbourne3.1 (19)5.3 (33)6.8 (44)9.9 (63)Greater Western Sydney2.5 (17)6.8 (44)10.11 (71)14.16 (100)
The rational approximation 171/100 for the cube root of 5 has never occurred, nor has the rational approximation 193/71 for e. The approximation 71/123 for γ has occurred twice:
111948Footscray4.3 (27)6.5 (41)8.8 (56)10.11 (71)Collingwood3.2 (20)11.5 (71)13.7 (85)19.9 (123)
102013Geelong3.2 (20)6.6 (42)9.10 (64)18.15 (123)Gold Coast3.2 (20)4.8 (32)9.10 (64)10.11 (71)
The approximation 22/7 for π is the best-known rational approximation of an irrational number. It has never occurred as a “lowest-term” score, but multiples have occurred twice, including one of the most remarkable games ever played, with which those into statistics are bound to be familiar:
21909Fitzroy3.5 (23)4.7 (31)7.14 (56)12.16 (88)Geelong1.2 (8)2.7 (19)3.9 (27)3.10 (28)
131983Fitzroy8.4 (52)13.8 (86)24.11 (155)34.16 (220)North Melbourne2.2 (14)8.3 (51)10.5 (65)10.10 (70)
This unusual topic came to my attention when I realised that commonly used rational approximations for irrational numbers almost always use numbers that are typical scores in football games, so that it is highly plausible that they could occur as a match score.

Your right into the numbers and maths etc

But its interesting how your brain works and you remember certain scores that are unique

I will give you a couple of examples where numbers have stuck in my head

Round 2 - 1969 never forgotten it Carlton v Hawthorn at Princess Park ,Blues won by a hell of alot , 20 plus goals - but their score that day and ive never forgotten this 30 goals and 30 behinds . And what reinforced your memory back then , in Melb on a Sat , the ABC TV - would have a total all sports result service about 5pm - and they would cross live to the match of the day which had just finished - theyd be kids kicking footballs on the ground and a couple of ex players , Roy Wright of Rich ( ex Brownlow/medalist ) was one of them , and he would give his review of the game , so you would see the match of the days final scores on a weekly basis

Another one in the same tune - round 17 - at Subiaco Frem v Geel - Cats kicked 20-20 , and purely because of that score ive allways remembered it

Is there many examples of that - say where the team has kicked at least 20 goals

But the Blues take the cake 30-30 that is a beauty
Particularly when those same Blues just won a Flag the previous season with a score of 7.14.56 over the Bombers 8.5.53, in conditions that were quite windy by all accounts but not affected by rain or mud.

Was 1969 the first season of 'Out of bounds on the full' as a free kick to the opposition? 60 scoring shots seems a staggering amount to have particularly when the 50's and 60's had generally low scoring. Then again 1969 began to herald the arrival of many great full forwards, in Wade (127 in '69) and them Mckenna, Hudson, Jesaulenko and even Geoff Blethyn who all kicked tons in the early 70's.

I recall that Geel/Sth Melb game in 1978, where at half time Geelong led 18.3.111 to 14.3.87. Cats won 26.11 to 24.11 at the Lake Oval. Thats season saw at least three 300+ score aggregates, St.K 204-Melb 141 being the highest ever early in the year, and the Dogs 213-St.K 106 in Rd 13, the day Templeton kicked 15 in addition to that Cats/Swans game. Heady times for your average footy fan marking off the scoring in the footy records in that era!
 
I recall that Geel/Sth Melb game in 1978, where at half time Geelong led 18.3.111 to 14.3.87. Cats won 26.11 to 24.11 at the Lake Oval. Thats season saw at least three 300+ score aggregates, St.K 204-Melb 141 being the highest ever early in the year, and the Dogs 213-St.K 106 in Rd 13, the day Templeton kicked 15 in addition to that Cats/Swans game. Heady times for your average footy fan marking off the scoring in the footy records in that era!

There was a fourth 300-plus aggregate in 1978. It was the first of the season from round 2 when Melbourne 24.23 (167) defeated Fitzroy 23.19 (157).
 
Your right into the numbers and maths etc

But its interesting how your brain works and you remember certain scores that are unique

I will give you a couple of examples where numbers have stuck in my head

Round 2 - 1969 never forgotten it Carlton v Hawthorn at Princess Park ,Blues won by a hell of alot , 20 plus goals - but their score that day and ive never forgotten this 30 goals and 30 behinds . And what reinforced your memory back then , in Melb on a Sat , the ABC TV - would have a total all sports result service about 5pm - and they would cross live to the match of the day which had just finished - theyd be kids kicking footballs on the ground and a couple of ex players , Roy Wright of Rich ( ex Brownlow/medalist ) was one of them , and he would give his review of the game , so you would see the match of the days final scores on a weekly basis

Another one in the same tune - round 17 - at Subiaco Frem v Geel - Cats kicked 20-20 , and purely because of that score ive allways remembered it

Is there many examples of that - say where the team has kicked at least 20 goals

But the Blues take the cake 30-30 that is a beauty
That 30-30 scoreline by Carlton in 1969 is one that has also stuck in my head.

The symmetry (balanced and proportionate) of the score makes it memorable.

I recall at the time there was a lot of media because it was such a high score for the era (1969 was the first year of the 'out on the full' rule).

I checked on AFL Tables and Carlton's score was the first time a team had kicked over 200 points in a game (Richmond's 30.19.199 in 1931 was the previous highest). It is still the 18th highest score kicked.

The 60 scoring shots was the highest ever recorded at the time, and the 30 behinds is still one of only a small number of games where a team has kicked 30 or more behinds in a game.

Of course, the score from the game featuring the current record for scoring shots and behinds is also one that sticks. In Round 6 - 1977, Hawthorn had 66 scoring shots to kick 25.41.191 and defeat St. Kilda by 88 points. That's a lot of kick-ins from the Saints' full back!
 
Was 1969 the first season of 'Out of bounds on the full' as a free kick to the opposition? 60 scoring shots seems a staggering amount to have particularly when the 50's and 60's had generally low scoring. Then again 1969 began to herald the arrival of many great full forwards, in Wade (127 in '69) and them Mckenna, Hudson, Jesaulenko and even Geoff Blethyn who all kicked tons in the early 70's.
Hudson had already kicked 125 goals in 1968, and kicked a further 120 in '69 (in both cases from 19 games).
McKenna also kicked 98 goals from 19 games in '69.
 
Hudson had already kicked 125 goals in 1968, and kicked a further 120 in '69 (in both cases from 19 games).
McKenna also kicked 98 goals from 19 games in '69.
1968 was when the VFL increased the number of Home & Away games from 18 to 20. It then increased to 22 games in 1970 with each of the 12 teams playing all other teams twice.

The extra games no doubt helped with the higher goal kicking tallies.
 
Cats are said to have nine lives, but in the AFL it would seem to be another type of feline - the Lions (both Fitzroy and Brisbane Lions) - that would seem to have nine lives when it comes to avoiding wooden spoons. To demonstrate:

1907 - Fitzroy are last after the 14 main rounds with 4-10 but win all of their three sectional rounds (the last year this system was used), sending Essendon to last and leap-frogging Geelong and Melbourne too to finish 5th of 8th.

1916 - Fitzroy finish last in a four team competition affected by World War I but win all their finals to take out the premiership. For many years Fitzroy were both premiers and wooden spooner for 1916, but in 2007 the AFL officially designated Richmond (which finished 3rd and didn't win a final) the last placed team for 1916 and took the wooden spoon off the Lions and gave it to the Tigers.

1932 - Entering the second last round, Fitzroy are last with just two wins but upset Essendon and are able to finish 10th above St Kilda and Hawthorn, the Lions, Saints and Hawks all going 3-15 that year.

1954 - The Lions start this season very badly with a 72-point hiding from Geelong, and things don't get much better, Fitzroy on the bottom from Rounds 1 to 17 inclusive. It seems they will spend the entire season in last position, but in an amazing upset defeated Essendon by 6 points in the last game to get off the bottom of the ladder and hand the wooden spoon to St Kilda.

1957 - An amazingly even season sees 5 teams spending time on the bottom of the ladder. For Fitzroy their turn in last was late in the season, and resulted in a final round wooden spoon 'grand final' between Fitzroy and Geelong at Brunswick Street in Round 18. The Lions easily accounted for the Cats, sending Geelong to last place for the first time that year and the 1957 wooden spoon to Kardinia Park.

1965 - Footscray enter the last round in last with three wins, the Lions second last just behind the 10th placed Hawks on percentage both with 4 wins. The Bulldogs upset Melbourne by 3 points and go to 10th, but even though Fitzroy lose to St Kilda the Lions stay in 11th rather than bottom. This is because the Lions loss to the Saints is in a high scoring match, while Hawthorn are thrashed by Geelong, this giving Hawthorn last place by less than one percent from Fitzroy.

1967 - Fitzroy are humiliated by Carlton by 94-points in Round 1 and stay last all year - until Round 17 when the Lions upset Melbourne by 2 points and go to 10th percentage in front of Footscray and Hawthorn. Hawthorn then play and comfortably beat Fitzroy in the wooden spoon grand final in the last round and go to 10th, but it is the Bulldogs (who lose only by 2 points to North) not the Lions who collect the 1967 wooden spoon by less than 1 percent. Like the Saints in 1954 and the Cats in 1957, this is the first time the Dogs have been last all season.

1977 - The Lions look sure to finish last in 1977 with only 3 wins by Round 18 in a dismal year, before Fitzroy find form in the last four rounds, winning three matches in this time and climbing to 10th over Melbourne (11th) and St Kilda (12th).

1991 - The last teams to play each other for the first time in 1991 would be future merger partners Fitzroy and the Brisbane Bears at the GABBA in a Sunday afternoon match in Round 16. Both teams had just one win for the year, but the Bears' percentage was better than the Lions due to some heavy Fitzroy defeats earlier in the season. Brisbane thrashed Fitzroy by 65-points, and even though Fitzroy were competitive to Melbourne and Collingwood in the next two rounds, when Brisbane upset Carlton in Round 18 in Carrara the Bears were 2 games and percentage worth way more than another game ahead of the Lions. And of the Lions run home, only one game looked a realistic chance, Richmond at the MCG in Round 20. The Lions not only beat the Tigers in this match they thrashed them, and then despite other heavy defeats in alternate weeks by Hawthorn and Sydney, were able to upset North by a point in Round 22 then minor premier the West Coast Eagles in Round 24. This left the Brisbane Bears, who didn't win again after Round 18, in last place for 1991 after a final round loss to the Bulldogs.

1994 - After heavy player losses following the 1993 season plus deteriorating finances, a determined Fitzroy actually started 1994 very well, but the depleted young side could not sustain it. The losses were narrow at first, but by mid-season grew heavier and in Round 20 Fitzroy would play the improving Sydney Swans at the SCG in the wooden spoon Grand Final. Somehow the Lions managed to win the worst match of the season, but four heavy defeats to end 1994 had them in danger of going to last in the final round, especially given the Swans were playing a team they had a good recent record against - Melbourne at the SCG. Sydney kicked what would usually be a winning score of 18.13-121, but to the Lions relief the Demons trumped them with 27.5-167 and saved Fitzroy from the 1994 wooden spoon.

2010 - It seems hard to believe that a team that was 4-0 after four rounds would be in a wooden spoon grand final by Round 19 especially when another team (Richmond) was 0-4 by this stage, but this was the reality when the Brisbane Lions played the West Coast Eagles at Subiaco Oval, a match in which the Queenslanders trailed most of the night before winning with a kick after the final siren. Another late season win saw the Lions go 7.15 and 13th.

2015 - Brisbane seemed certain to finish last after a poor season, but upset the finals-bound Bulldogs in the final round, and sending Carlton to last when the Blues lost to Essendon.

2016 - Essendon were last most of 2016, but after upsetting a listless Carlton on the Saturday in the final round, the Bombers drew ahead of Brisbane by a narrow percentage. The Lions didn't help their cause the next day by getting thrashed by St Kilda by 58-points, but because it was a high-scoring match (25.13-163 to 15.15-105), this actually boosted the Lions percentage back above that of Essendon and sending the Bombers to last and their first wooden spoon since 1933. Had the match been a low scoring match - say 15.3-93 to 5.5-35 - the Brisbane Lions would have been last.
 
Last night's crazy shootout reminded me:
From 1969 1968-2016, every single season had at least one game with a combined score of 250+. After that, there were zero 250+ point aggregates from 2017-2023.

Youve got to be kidding - a shootout !!!!

Geelong had a lousy 8-9 goals on the board with about 7 and a half minutes to go . Suns kicked a goal to go either exactly 12 or 13 goals in front , i thought this is edging a little bit close for comfort to the century point winning margin , and thus thought it would be a very tough 7 minute watch , so i turned it off

12 minutes later i looked up the final score and saw Geel had kicked 15 goals - i nearly fell over backwards
 

Remove this Banner Ad

Stats observations

Remove this Banner Ad

Back
Top