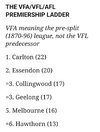
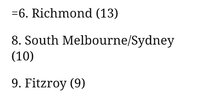
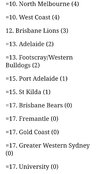
So that settles it and confirms what everyone already knows.Performance metric of each club measured against time in the competition. Source AFL tables.
Metrics
Flags
GS's
Finals won
Finals played.
Metric divided by years in the comp, for example Adelaide have 2 flags divided by 33 years gives them an average of 0.0606 premierships per year.
Just my opinion but these metrics separate those on equal number of flags with equal time in the competition.
Flags GF Finals Won Finals played Years in comp Total averages Ade 2 3 18 36 33 Averages 0.0606 0.0909 0.5454 1.0909 1.7878 Bris 4 5 20 32 37 Averages 0.108 0.1351 0.54054 0.8648 1.6484 Collingwood 16 43 84 190 127 Averages 0.1259 0.3385 0.6614 1.496 2.6218 Carlton 16 29 67 143 127 Averages 0.1259 0.2283 0.5275 1.1259 2.0076 Essendon 16 28 69 132 127 Averages 0.1259 0.2204 0.5433 1.0393 1.9289 Fremantle 0 1 7 17 29 Averages 0 0.0344 0.2413 0.5862 0.8619 Geelong 10 19 60 134 127 Averages 0.0787 0.1496 0.4274 1.0551 1.7108 GC 0 0 0 0 13 Averages 0 0 0 0 0 GWS 0 1 9 18 12 Averages 0 0.0833 0.75 1.5 2.3333 Hawthorn 13 19 54 87 99 Averages 0.1313 0.1919 0.5454 0.8787 1.7473 Melbourne 13 18 54 94 127 Averages 0.1023 0.1417 0.4251 0.7401 1.4092 North Melbourne 4 9 35 75 99 Averages 0.0404 0.0909 0.3535 0.7575 1.2423 Port Adelaide 1 2 14 30 27 Averages 0.037 0.074 0.05185 1.1111 1.2739 Ricmond 13 24 56 94 116 Averages 0.112 0.2068 0.4827 0.8534 1.6549 St Kilda 1 7 22 55 127 Averages 0.0078 0.0551 0.1732 0.433 0.6691 Syd / Sth Melb 5 19 44 97 127 Averages 0.0393 0.1496 0.3464 0.7637 1.299 West Coast 4 7 26 55 37 Averages 0.1081 0.1891 0.7027 1.4864 2.4863 WB / Footscray 2 4 21 57 99 Averages 0.0202 0.0404 0.2121 0.5757 0.8484 Fitzroy 8 13 34 59 127 0.0629 0.1023 0.2677 0.4645 0.8974
1. Collingwood
2. West Coast
The Rest.


