Play Nice 2024 Non AFL Crowds/Ratings and other Industry thread

Remove this Banner Ad

Sunday #AuSportTV
#AUSvIND
4T D4 S4 1.563m (Rch 2.892m)
4T D4 S2 1.257m (2.431m)
4T D4 S1 1.121m (2.089m)
4T D4 Tea 1.218m (1.605m)
4T D4 Lunch 940k (1.590m)
4T D4 Pre 499k (1.151m)

#bbl
Heat/Sixers 724k (2.364m)
Post 215k (480k)

#UnitedCup
D3 -Day 98k (937k)

#BrisbaneInternational
D1 - Night 90,000 (603k)

Data: VOZ
 
By my count, the MCG has held 80k+ crowds for 20 seperate events in 2024.

13 AFL games drew 80k+ crowds at the MCG, as did 3 seperate days of Test cricket, 3 Taylor Swift concerts, and 1 NRL State Of Origin match.

Wouldn't be many stadiums anywhere in any given year to match that record.
AFL matches alone now deliver more than 3m in aggregate attendances per year: add everything else and we're approaching 4 million. There may not be another stadium anywhere that matches that.
 

Log in to remove this ad.

Rugby League

Rugby League reported 72.877 million viewers from 115 fixtures on Nines free to air coverage at an average of 634,000 per match, with the NRL season accounting for 91 fixtures at an average of 583,000 for a total of 53.076m.

Womens league add 1.93m million viewers to the total – with many matches not rated, while representative league added 16.543m viewers on Nine.


On Foxtels streaming services, League added 60.866 million viewers at an average of 251,000 across 243 rated fixtures. Many womens matches went unrated here.


Fox Group did release some data two weeks before finals that showed an NRL match average across set top box an streaming of 483,000 per game.

Martin Medcraf, Foxtel Media sport sales and partnerships director to Mediaweek: “NRL rounds 1-25 followed suit with an average audience of 483,000, +18% from last season”.

Foxtel Group also announced that the 2024 NRL Telstra Premiership Season has broken records as the most watched of all time across its platforms – Foxtel, Foxtel Now, Foxtel Go and Kayo Sports. It is the seventh consecutive year of viewership growth.

Kayo Sports viewership surged 30% year on year. There were five billion minutes streamed across all Foxtel Group streaming platforms which was up 30% compared to 2023. A huge 59% of the total Foxtel Group audience streamed the coverage.

In 2024, NRL kicked off its season in Las Vegas with the Sea Eagles v Rabbitohs game, exclusive on Fox League, followed by the Roosters v Broncos game. Both games smashed viewership records and are the two most watched games of all time across Foxtel Group platforms. The coverage, which was Logie-nominated, also drove the biggest single day of sign-ups on Kayo Sports.

Magic Round recorded the highest audience ever for a regular season round across the Foxtel Group with an average audience of 545,000.

  • Raiders v Bulldogs 592,000.
  • Sharks v Roosters 664,000
  • Storm v Eels 589,000
Andrew Abdo noted in an AFR interview that NRL total ratings were 153.7 million viewers, compared to the AFL’s 140.3 million

Origin 2024

The three game Mens series, which averaged 3.409 million viewers per match (up 14.9% year-on-year), ranks as the three highest rating programs of the year (based on overnight figures). The series recorded an average BVOD audience of 788,000 per match – up an incredible 50.4% year-on-year.

  • Origin I rated 3.396 million across the Nine Network with 768,000 watching on 9NOW. The match reached 5.269 million viewers nationally. The Metro viewing audience was 2.256 million and was the number 1 program in Sydney, Melbourne and Brisbane on the night. (including BVOD)
  • Origin II rated 3.208 million across the Nine Network with 748,000 watching on 9NOW. The match reached 5.19 million viewers nationally. It was the number one program for the night in Sydney (902,000) and Brisbane (538,000), and number two in Adelaide (86.000) and Perth (116,000). The Melbourne audience was 258,000. It was the highest rating Origin II since 2017.
  • Origin III rated 3.610 million across the Nine Network, with 882,000 watching on 9NOW. The match reached 5.389 million viewers nationally. In the metro 5 city catchment, ratings totaled 2,373,000 – this included 1,750,000 broadcast and 623,000 BVOD viewers.
Womens Origin

The first ever 3 match Women’s State of Origin Series recorded a series average Total TV Audience of over 1 Million, up 67.8% year-on-year and a series average BVOD audience of 165,000, up 156.9% year-on-year.

  • Origin 1 rated 977,000, including 136,000 on 9NOW with a national reach of 2.11 million.
  • Origin II rated 1.083 million, including 172,000 on 9NOW with a national reach of 2.12 million.
  • Origin III rated 1.101 million, including 183,000 on 9NOW with a national reach of 2.205 million.
Pacific Championships

  • The 2024 Pacific Championships delivering record-breaking attendance and viewership, with a total audience of 6.2m across all tournaments, marking a significant 40% YoY increase;
  • The Pacific Cup final between Australia and Tonga drawing 1m viewers – a 79% increase on the 2023 decider between the Kangaroos and Kiwis;
  • The Kangaroos vs Kiwis Test in Christchurch attracting 545k viewers on FTA and nearly 1m views across all platforms, surpassing last year’s corresponding match by 22% and exceeding both Bledisloe Cup fixtures earlier this year, which attracted 477k and 283k FTA viewers respectively;
Womens Pacific Championships

  • The Pacific Cup final between the Jillaroos and Kiwi Ferns attracting 353k viewers;
  • The Jillaroos achieving an average viewership of 274k throughout the tournament;
  • 1.4m people tuning in to watch the women’s Pacific Championships;
  • Average viewership for the women’s Pacific Bowl matches increasing by 18% from last year’s tournament, underscoring the growing support of the women’s international game.
 
NBL

Opening round attendance and tv viewing soared across all subscription and streaming platforms in a record-breaking opening round, with an added record of the most attendees in League history. The seven games broadcast from Thursday to Sunday achieved more than 40% year-on-year increase in average audience on ESPN, via KAYO and Foxtel.

The Melbourne United v Tasmania JackJumpers Championship Series headlined the League’s incredible growth, with broadcast ratings up 52% on last season’s Series, including a jump in viewership on Game 5 – a 35% increase on last year.

The broadcast ratings across the entire season increased by 26%, including a more than 27% jump across the Finals.

SuperNetball

The 2024 Suncorp Super Netball season has emerged as the most watched season in history on the Foxtel Group‘s linear and streaming platforms, including Foxtel, Kayo Sports, Foxtel Now, and Foxtel Go.

This milestone marks the third consecutive year of viewership growth for the league. Streaming audiences have notably increased for three straight years, with 63% of viewers now accessing netball content on Kayo Sports, Foxtel Now, and Foxtel Go.

Over the course of the season and the finals series, more than 210 million minutes were streamed across all matches.

In June Foxtel noted that

  • Super Netball’s opening round achieved the highest opening round of all time
  • Super Netball achieved its biggest audience ever for a game during the Vixens v Fever game in round 7
  • The 2024 Super Netball regular season has produced the top five regular season rounds in the history of Super Netball’s partnership with Foxtel Group
  • The 2024 Super Netball season has produced the top 10 individual regular season match audience since the start of its broadcast partnership with Foxtel Group in 2022
Racing

Seven’s Spring Racing Carnival coverage, which includes celebrated meets on the Australian thoroughbred racing calendar and a procession of Group 1 races, has scored an average national total TV audience of 178,000.

Everest Day at Royal Randwick and the Caulfield Cup at Caulfield Racecourse reached 1.39 million people and had an average audience of 557,000. The Big Dance day at Royal Randwick reached 1.51 million, with an average audience of 192,000, while the Cox Plate at Mooney Valley reached 1.04 million with an average audience of 162,000 and the Golden Eagle day at Rosehill Gardens reached 1 million and had an average audience of 119,000.

Nine’s coverage of the Lexus Melbourne Cup on 5 November attracted a National Total TV average Audience of 1.910 million viewers, marking an 11.3% increase compared to last year.

Formula one

In June, Fox reported that The 2024 F1™ season has delivered two of the top 10 race audiences since Foxtel Group started exclusively broadcasting the rights in 2017. The 2024 F1® Australian Grand Prix streaming audiences were up four per cent year on year.
 
Australian sport combined to delivered 504.413 million viewers across the country on free to air broadcasting more than 905 live game events in the 2024 Calendar year (aggregated average viewers). Of those 45.709 million (9.06%) were watching on free to air streaming channels, including Cricket for the first time. And these are just the ones we know about.

On Foxtel streaming services (Go/Now/Kayo), Oztam reported 140.628m aggregated average viewers, across 717 live sporting events.

Before we go further, please note all Data comes from VOZ, and the daily top 30 consolidated ratings list, as well as Oztams VPM ratings (now unfortunately discontinued) and their top 20 weekly lists. For sports like the NRL, Super Rugby and Aleague, please note that ratings from NZ, PNG, Fiji and elsewhere are pretty thin on the ground, and so international ratings may not be present in this article. Further Foxtel data for set top boxes is basically non existent with only scattered details available. As usual, silence emanates from Paramount, Stan and Optus Sport.

The Top Ratings

While the AFL Grand Final was the clear winner for Seven, the FTA top Ten list is dominated by Rugby league (3 x Origins and 1x Grand Final) and Olympic coverage. (Seven notes that its AFL Grand FInal surrounding coverage also makes the list, but we havent included pre,post, breaks or non live match coverage). The Melbourne cup comes in at 11th


Olympic coverage dominates the top 20 and top 30, with 25 programmes inside the top 40.

If you remove Olympic coverage (as Seven did in its 2024 coverage release), the top Ten also includes the Melbourne Cup, and Cricket, but the Nine network still wins 7-3.


With The Olympics gone, the top 20 is largely Cricket – the fourth test is still to be consolidated – and Test cricket makes up half the entries in the top 40.

Top rated events per Sport


With Foxtels streaming ratings, the Top 10 is dominated by the AFL, thanks to some big finals, and blockbuster viewing in the last round – the AFL takes 8 of the top 10


The AFL makes up 12 of the top 20, and the AFL and NRL split the honours at 20 matches each inside the top 40,

Holy shit, Rugby Union is absolutley dead. It's not even a zombie sport anymore.
 
Australian sport combined to delivered 504.413 million viewers across the country on free to air broadcasting more than 905 live game events in the 2024 Calendar year (aggregated average viewers). Of those 45.709 million (9.06%) were watching on free to air streaming channels, including Cricket for the first time. And these are just the ones we know about.

On Foxtel streaming services (Go/Now/Kayo), Oztam reported 140.628m aggregated average viewers, across 717 live sporting events.
I appreciate your work, Wooks, but this analysis really would be improved by using hours or minutes watched rather than aggregating average ratings across a given year. For one thing, minutes/hours watched lends itself to aggregation, average ratings don't. Claiming there were "504.413 million viewers" in a country with a population of 27 million just seems odd.

Also, minutes/hours watched is just more tangible: you can run the numbers to estimate that Australians watched on average X hours across the year, X hours per week etc etc. Media outlets are much more likely to pick up on that type of analysis.
 

(Log in to remove this ad.)

I appreciate your work, Wooks, but this analysis really would be improved by using hours or minutes watched rather than aggregating average ratings across a given year. For one thing, minutes/hours watched lends itself to aggregation, average ratings don't. Claiming there were "504.413 million viewers" in a country with a population of 27 million just seems odd.

All major sports in this country aggregate their average ratings. Its been a thing for almost a decade.

Also, minutes/hours watched is just more tangible: you can run the numbers to estimate that Australians watched on average X hours across the year, X hours per week etc etc. Media outlets are much more likely to pick up on that type of analysis.

Also hours/minutes watched is not available via VOZ. and broadcasters are only reporting it for BVOD. That data is not available.
 
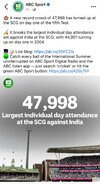
Highest scg cricket attendance in its current configuration by 2,000 people. Quite a way about afl attendances as well.

I wonder how they’ve done it? Looks like it’s a bigger attendance than seats at the ground, considering the size of the sight screens. Are there corporate tickets that don’t get access to seats but to corporate areas instead? Or is it by members leaving part way through the day being replaced by members coming just for the last session? Perhaps doing the old counting workwrs as well?

That's a good point, they probably count people that go and come later throughout the day.
 

Remove this Banner Ad

Play Nice 2024 Non AFL Crowds/Ratings and other Industry thread

Remove this Banner Ad

Back
Top