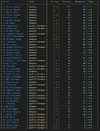
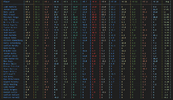
It’s interesting that these ratings (both in general and in the match just gone) are favouring Rankine so heavily over Soligo.
Navigation
Install the app
How to install the app on iOS
Follow along with the video below to see how to install our site as a web app on your home screen.
Note: This feature may not be available in some browsers.
More options
-
 BigFooty AFLW Notice Img
AFLW 2024 - Round 10 - Chat, game threads, injury lists, team lineups and more.
You are using an out of date browser. It may not display this or other websites correctly.
You should upgrade or use an alternative browser.
You should upgrade or use an alternative browser.
Analysis Crows Player Ratings
- Thread starter Interloperer
- Start date
- Tagged users None
His disposals are super damaging I guess? Had 11 touches against Port for 3 goals and 2 goal assists, and was 4th for the team for metres gained despite having half the disposals of the rest of the top 5.It’s interesting that these ratings (both in general and in the match just gone) are favouring Rankine so heavily over Soligo.
Golumless
A bigger deal out west.
His disposals are super damaging I guess? Had 11 touches against Port for 3 goals and 2 goal assists, and was 4th for the team for metres gained despite having half the disposals of the rest of the top 5.
I do remember the Champion data guy on SEN mentioning a few weeks back that they've pushed to really punish inaccuracy in goal kicking in the ratings this year, so I think this damage thought is probably on the money.
Scorpus
Moderator
- Apr 16, 2014
- 61,657
- 164,863
- AFL Club
- Adelaide
- Moderator
- #104
Surely punishing inaccurate goal kicking more should only be implemented if the amount of scoring from kick ins has increasedI do remember the Champion data guy on SEN mentioning a few weeks back that they've pushed to really punish inaccuracy in goal kicking in the ratings this year, so I think this damage thought is probably on the money.
Not that I definitively know this to be true but my understanding of the ratings is that if a player gets the ball in a position (e.g. close to goal) where the expected score is, say, four points but ends up only actually scoring a point then in effect their involvement has cost the team three points and so this is reflected in their player rating for the match.Surely punishing inaccurate goal kicking more should only be implemented if the amount of scoring from kick ins has increased
Then repeat this for all of their involvements in the match (i.e. does each involvement the player has positively or negatively impact the xScore for us or our opponent at any given time) and you get their aggregate impact for the match. Whether this translates directly to rating points or if there is some other metric involved I'm not sure.
- Aug 5, 2013
- 2,565
- 2,306
- AFL Club
- Adelaide
- Thread starter
- #106
Rankine's scored a few goals straight from clearances or similarly contested ball. So he'll get the credit both for creating the chance and also converting it.It’s interesting that these ratings (both in general and in the match just gone) are favouring Rankine so heavily over Soligo.
To my knowledge (a combination of that absurdly long academic paper I linked earlier and "stuff I heard on the internet"), the ratings started from the theory that 1 rating point should be analogous to 1 point on the scoreboard. So if you add up all the player ratings of both sides and subtract the loser from the winner. It should match the margin. except for two things:Not that I definitively know this to be true but my understanding of the ratings is that if a player gets the ball in a position (e.g. close to goal) where the expected score is, say, four points but ends up only actually scoring a point then in effect their involvement has cost the team three points and so this is reflected in their player rating for the match.
Then repeat this for all of their involvements in the match (i.e. does each involvement the player has positively or negatively impact the xScore for us or our opponent at any given time) and you get their aggregate impact for the match. Whether this translates directly to rating points or if there is some other metric involved I'm not sure.
- There's obvious the points left over at the end of each quarter with no corresponding score
- The AFL and/or Champion Data seem to have made some changes based purely on vibes. eg. An effective handball can never score less than 0 rating points, even though by the algorithm it could be negative. (the famous backwards and sideways hospital handball)
- Aug 5, 2013
- 2,565
- 2,306
- AFL Club
- Adelaide
- Thread starter
- #107

Pure Class Ratio: Izak Rankine
PLAYERCARDSTART
23
Izak Rankine
- Age
- 24
- Ht
- 181cm
- Wt
- 82kg
- Pos.
- Fwd
Career
Season
Last 5
- D
- 13.0
- 3star
- K
- 9.0
- 3star
- HB
- 4.0
- 3star
- M
- 2.7
- 3star
- T
- 2.7
- 4star
- G
- 2.0
- 5star
- D
- 13.0
- 3star
- K
- 9.0
- 4star
- HB
- 4.0
- 3star
- M
- 2.7
- 3star
- T
- 2.7
- 4star
- G
- 2.0
- 5star
- D
- 13.0
- 4star
- K
- 9.0
- 4star
- HB
- 4.0
- 3star
- M
- 2.7
- 3star
- T
- 2.7
- 5star
- G
- 2.0
- 5star
PLAYERCARDEND
Quantity Over Quality: Daniel Curtin (-0.06)
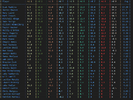
Rankine is currently in the top ten players in the competition by the AFL Player Ratings!
- Aug 5, 2013
- 2,565
- 2,306
- AFL Club
- Adelaide
- Thread starter
- #109
some delays this week, while I figure out how the AFL data is handling "Kuwarna"
- Aug 5, 2013
- 2,565
- 2,306
- AFL Club
- Adelaide
- Thread starter
- #110
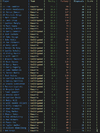
Pure Class Ratio: Lachlan Murphy
PLAYERCARDSTART
4
Lachlan Murphy
- Age
- 25
- Ht
- 174cm
- Wt
- 83kg
- Pos.
- Fwd
Career
Season
Last 5
- D
- 9.8
- 2star
- K
- 5.8
- 2star
- HB
- 4.0
- 3star
- M
- 2.3
- 2star
- T
- 3.4
- 5star
- G
- 0.9
- 4star
- D
- 8.8
- 2star
- K
- 4.8
- 2star
- HB
- 4.0
- 3star
- M
- 1.8
- 2star
- T
- 3.2
- 4star
- G
- 0.7
- 4star
- D
- 9.0
- 3star
- K
- 6.2
- 3star
- HB
- 2.8
- 3star
- M
- 1.8
- 2star
- T
- 3.6
- 5star
- G
- 1.0
- 4star
PLAYERCARDEND
Quantity Over Quality: Ben Keays
PLAYERCARDSTART
2
Ben Keays
- Age
- 27
- Ht
- 186cm
- Wt
- 86kg
- Pos.
- Fwd
Career
Season
Last 5
- D
- 13.1
- 3star
- K
- 5.8
- 2star
- HB
- 7.3
- 5star
- M
- 2.3
- 2star
- T
- 3.9
- 5star
- G
- 0.4
- 3star
- D
- 13.7
- 3star
- K
- 8.7
- 3star
- HB
- 5.0
- 3star
- M
- 2.8
- 3star
- T
- 3.7
- 4star
- G
- 0.3
- 3star
- D
- 13.0
- 4star
- K
- 4.8
- 2star
- HB
- 8.2
- 5star
- M
- 1.4
- 2star
- T
- 4.4
- 5star
- G
- 0.4
- 3star
PLAYERCARDEND
dogs105
Sweet Kennels Proprietor
Nick Daicos. 41 possessions, 10 ranking points.
- Aug 5, 2013
- 2,565
- 2,306
- AFL Club
- Adelaide
- Thread starter
- #113
19.2 vs Sydney last year. Next best last year was 14.When was the last time Murphy had 15 rating points in a game? Felt like an unusually high impact game for him.
It was an unusual amongst his better games though. Because he did all his good work outside the contest. Getting on the scoresheet and 3 goal assists help (+ setting up a horrendous Keays shank).
Normally his better games are noted by clearances and high percentage of contested possessions.
FR0GGY
From a cartel villa in Tuscany
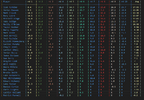
What don’t they value, for max to be so low?View attachment 1992610
Pure Class Ratio: Lachlan Murphy (0.27)
Quantity Over Quality: Ben Keays (-0.03)
View attachment 1992612
I know he doesn’t get a lot of it but he doesn’t make a mistake very often.
Last edited:
dogs105
Sweet Kennels Proprietor
Very, very good in the first half. I'd keep him for next week, but on a short leash if he doesn't performWhen was the last time Murphy had 15 rating points in a game? Felt like an unusually high impact game for him.
But he already didn't perform in the 2nd half (only had 3 possessions) when the side was still in the contest so it wasn't like he didn't have the opportunity to perform.Very, very good in the first half. I'd keep him for next week, but on a short leash if he doesn't perform
Honestly the ranking points got this one right.Nick Daicos. 41 possessions, 10 ranking points.
- Aug 5, 2013
- 2,565
- 2,306
- AFL Club
- Adelaide
- Thread starter
- #118
There's a known weakness in the ratings with purely defensive roles (shutdown defenders and taggers) which is probably whats at play here. Most of his good work is keeping other players (and himself in the process) out of the contest.What don’t they value, for max to be so low?
I know he doesn’t get a lot of it but he doesn’t make a mistake very often.
skimming the stats. Most of Michelanney's possessions are uncontested, and low metres gained (he's had multiple games with zero "rebound 50s" despite playing deep in defense). People have made the comment his disposal has been a bit sketchy at times this year too.
Compared to someone like Keane, a defensive player who is well represented in the rankings, he takes relatively few contested marks and his "1%'er" count is way lower.
Quiet second half, but still a solid game on the whole. If that was Murphy's game every week he'd be worth a spot in the team. Problem is he tends to go missing for entire games as well.But he already didn't perform in the 2nd half (only had 3 possessions) when the side was still in the contest so it wasn't like he didn't have the opportunity to perform.
- Aug 5, 2013
- 2,565
- 2,306
- AFL Club
- Adelaide
- Thread starter
- #120
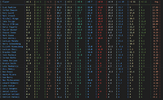
So we had the top 7 players on the field and they had the bottom six!
Interestingly both Crouch and Sholl who had heaps of the ball were well down on the CD ratings.
Interestingly both Crouch and Sholl who had heaps of the ball were well down on the CD ratings.
- Aug 5, 2013
- 2,565
- 2,306
- AFL Club
- Adelaide
- Thread starter
- #122
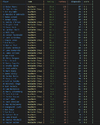
Pure Class Ratio: Brayden Cook (0.36)
Quantity Over Quality: Taylor Walker
PLAYERCARDSTART
13
Taylor Walker
- Age
- 34
- Ht
- 194cm
- Wt
- 102kg
- Pos.
- Fwd
Career
Season
Last 5
- D
- 13.0
- 3star
- K
- 9.0
- 3star
- HB
- 4.0
- 3star
- M
- 5.7
- 5star
- T
- 1.6
- 4star
- G
- 2.3
- 5star
No current season stats available
- D
- 8.0
- 2star
- K
- 6.4
- 3star
- HB
- 1.6
- 2star
- M
- 4.2
- 4star
- T
- 1.6
- 4star
- G
- 1.6
- 5star
PLAYERCARDEND
- Aug 5, 2013
- 2,565
- 2,306
- AFL Club
- Adelaide
- Thread starter
- #123
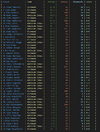
Pure Class Ratio: Ben Keays
PLAYERCARDSTART
2
Ben Keays
- Age
- 27
- Ht
- 186cm
- Wt
- 86kg
- Pos.
- Fwd
Career
Season
Last 5
- D
- 13.1
- 3star
- K
- 5.8
- 2star
- HB
- 7.3
- 5star
- M
- 2.3
- 2star
- T
- 3.9
- 5star
- G
- 0.4
- 3star
- D
- 13.7
- 3star
- K
- 8.7
- 3star
- HB
- 5.0
- 3star
- M
- 2.8
- 3star
- T
- 3.7
- 4star
- G
- 0.3
- 3star
- D
- 13.0
- 4star
- K
- 4.8
- 2star
- HB
- 8.2
- 5star
- M
- 1.4
- 2star
- T
- 4.4
- 5star
- G
- 0.4
- 3star
PLAYERCARDEND
Quantity Over Quality: Billy Dowling (0.04)
- Aug 5, 2013
- 2,565
- 2,306
- AFL Club
- Adelaide
- Thread starter
- #125
Similar threads
- Replies
- 63
- Views
- 5K
- Replies
- 0
- Views
- 184


