Analysis Season 2023 - Statistics and Analytics Thread

Remove this Banner Ad

Status
Not open for further replies.
Oct 13, 2015
10,077
25,795
AFL Club
Brisbane Lions
Trying something new here as unfortunately getting access to AFL stats can be really difficult, and its hard to make it accessible/easy to find for everyone by posting it in game review threads.

I also want to highlight the great work being done by people to analyse the game outside of the traditional AFL media - e.g. Richard Little on twitter who briztoon has posted some interesting graphics from, and others.

Hopefully this can be an easy place for people to drop in Lions-related analysis and stats this season, and I'll try post things as I come across them every week.
 
Expected score

If you don't know much about expected score, Foxfooty did a bit of an explainer on it last year:


The key points regarding the champion data formula (which I think is what appears in the Herald Sun each week) are:
  • Every shot on goal is analysed, based on where on the ground it was taken and how much pressure the player was under.
  • The expected accuracy of the shot is determined based on the results from that location and pressure level over the last decade of AFL matches.
  • For example, a set shot from 30 metres out on a 45-degree angle has an expected accuracy of 50 per cent. So a team would be expected to score three points (reflecting the 50-50 chance of a goal).
    • If they kick the goal, their expected score would be 3, but their actual score would be 6.
    • If they kick a behind instead, their expected score would still be 3, with their actual score being 1.
  • Over the course of a game these incidents add up to create an expected score for the match.
  • The expected score of each shot does not take into account the individual player’s records, nor the team’s records. It always uses the league-wide standard.
Expected score isn't everything and conversion absolutely matters - but it is a useful indicator of a teams performance.

As posted in the review thread - here is the expected score ladder after Round 7 based on the herald sun expected score numbers:


As I said in the review thread, the key takeaways for me are that the Saints' opponents have converted really really badly so far, and Melbourne is massively overperforming on expected score.

AFL lab on twitter runs a slightly different expected score formula, but has observed a similar thing:


Key takeaway for us - I think that so far our whole team defence is going a little bit better than the actual points we've conceded. As you can see from the above graph, our opponents have been more accurate than expected but in actuality our expected scores against is actually not far off the top defensive teams.
 
Good thread.

I’m assuming the key factors which influence underperformance and outperformance are environmental factors and venue.

Eg
I’d expect Geelong to have an higher likelihood of outperformance at GMHBA.
I’d expect a higher likelihood of outperformance at Marvel compared to Launceston.
 

Log in to remove this ad.

Expected score

Key takeaway for us - I think that so far our whole team defence is going a little bit better than the actual points we've conceded. As you can see from the above graph, our opponents have been more accurate than expected but in actuality our expected scores against is actually not far off the top defensive teams.

My one query on expected score is on context. Yes, it separates set shots from shots in general play.

But I highly doubt it separates the goal in general play when you are streaming towards goal with nobody anywhere near you, vs when you are surrounded by 5 opponents and forced onto your wrong foot.

This could potentially be a source of teams' defences appearing consistently better/worse than expected score suggests.
If they have the data, factoring in how close defenders are should be straightforward. Once you get beyond that (wrong foot, etc) it would start getting difficult to separate that from general noise.
 
My one query on expected score is on context. Yes, it separates set shots from shots in general play.

But I highly doubt it separates the goal in general play when you are streaming towards goal with nobody anywhere near you, vs when you are surrounded by 5 opponents and forced onto your wrong foot.

This could potentially be a source of teams' defences appearing consistently better/worse than expected score suggests.

Champion data’s expected score does take into account pressure - but how much you can quantify pressure is unclear to me.

Re the saints over performance, over half of it has come from the opposition missing set shots so I think it is just genuine luck.

 
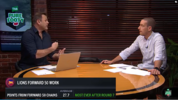
Some points from the Heraldsun's Purefooty show (available to watch for free on the herald sun website if you can stomach 15-20 mins of David King):

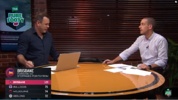
  • Brisbane are number one for points from forward 50 chains at 27.7 per game - this is the most ever after round 7. What wasn't clear was the definition of a 'forward 50 chain,' but my understanding is that this would be points from a chain of play that starts in our forward 50, i.e. including points from turnovers we have generated in our forward 50, or points from stoppage in our forward 50. I'm not certain of this though as the Champion Data glossary doesn't cover this: Glossary – AFL – Champion Data

1683160845074.png


  • We've scored clearly the most from F50 Stoppages at 109 points - the next highest is the bulldogs with 75 points, and Geelong and the Dees were around the 70-75 point mark as well. According to Champion Data the average score per F50 stoppage a game is about a goal, so we are going at around 15 points per game and the next best are going at around 10 points per game.
1683160923735.png
 
Some points from the Heraldsun's Purefooty show (available to watch for free on the herald sun website if you can stomach 15-20 mins of David King):

  • Brisbane are number one for points from forward 50 chains at 27.7 per game - this is the most ever after round 7. What wasn't clear was the definition of a 'forward 50 chain,' but my understanding is that this would be points from a chain of play that starts in our forward 50, i.e. including points from turnovers we have generated in our forward 50, or points from stoppage in our forward 50. I'm not certain of this though as the Champion Data glossary doesn't cover this: Glossary – AFL – Champion Data

View attachment 1677556


  • We've scored clearly the most from F50 Stoppages at 109 points - the next highest is the bulldogs with 75 points, and Geelong and the Dees were around the 70-75 point mark as well. According to Champion Data the average score per F50 stoppage a game is about a goal, so we are going at around 15 points per game and the next best are going at around 10 points per game.
View attachment 1677557

Thoughts martinson ;)
 
I'm not sure how to link it but there is a new SEN evening show with Gerard Healy and Kane Cornes and they have an hour each Tuesday where Daniel Hoyne comes in and breaks some numbers down. Most recent he said if Daniher keeps up the last 4 weeks then he's in the AA conversation, and that Harris is flying up the key defenders ladder with a bullet, I think now around 5th. Sam Taylor was first, poor bloke. He also compares coaches votes to statistical influence and identifies discrepancies which is always interesting (for a full data nerd like me anyway!)
 
I'm not sure how to link it but there is a new SEN evening show with Gerard Healy and Kane Cornes and they have an hour each Tuesday where Daniel Hoyne comes in and breaks some numbers down. Most recent he said if Daniher keeps up the last 4 weeks then he's in the AA conversation, and that Harris is flying up the key defenders ladder with a bullet, I think now around 5th. Sam Taylor was first, poor bloke. He also compares coaches votes to statistical influence and identifies discrepancies which is always interesting (for a full data nerd like me anyway!)
Hmmmm... We're probably due for a bit of a stinker then, to disrupt all our numbers and allow us to keep flying under the radar.

Also I was amused when Hoyne said the stats indicate Collingwood actually aren't quite as good as people think. Well, yes, that's what happens when many of your wins are close and your % is only 117.

Think about it this way... If you kick 13 goals to 12, that means your game plan succeeds 52% of the time but FAILS 48% of the time. That's pretty high for a "winner" especially when you consider how binary the media treats results.
 
I'm not sure how to link it but there is a new SEN evening show with Gerard Healy and Kane Cornes and they have an hour each Tuesday where Daniel Hoyne comes in and breaks some numbers down. Most recent he said if Daniher keeps up the last 4 weeks then he's in the AA conversation, and that Harris is flying up the key defenders ladder with a bullet, I think now around 5th. Sam Taylor was first, poor bloke. He also compares coaches votes to statistical influence and identifies discrepancies which is always interesting (for a full data nerd like me anyway!)
Even if that were the case and Joe in particular and to lesser extent Harris were clear no 1 in these numbers - I have no doubt they'd be lost on the bias AA selectors who generally only have Big Vic club glasses unless the form of a player from interstate is unamnimously spoken about by the Vic media, fans and the rest.

No way Joe cpuld ever get in with golden boys the likes of Curnow and Cameron running around which superises as Daniher is one of those footy royalty names in the AFL although it rarely extentds to Joe.

Same for Harris this year, the likes of Moore and Weitering will see that he is nowhere near it. Hell, Tom Stewart can miss 6 odd games in a season and still gets in and then the likes of Mal Michael despite being a beast and the dominant backmen of the leaguse for 5 years couldnt get a look in.
I think Daniher has a reasonable chance if you consider 2nd ruck duties as an argument for the third tall. Hes competing with Hawkins though, most other tall forwards are not impressive
 
Even if that were the case and Joe in particular and to lesser extent Harris were clear no 1 in these numbers - I have no doubt they'd be lost on the bias AA selectors who generally only have Big Vic club glasses unless the form of a player from interstate is unamnimously spoken about by the Vic media, fans and the rest.

No way Joe cpuld ever get in with golden boys the likes of Curnow and Cameron running around which superises as Daniher is one of those footy royalty names in the AFL although it rarely extentds to Joe.

Same for Harris this year, the likes of Moore and Weitering will see that he is nowhere near it. Hell, Tom Stewart can miss 6 odd games in a season and still gets in and then the likes of Mal Michael despite being a beast and the dominant backmen of the leaguse for 5 years couldnt get a look in.

To be entirely fair I have watched a fair bit of Geelong and Jeremy Cameron is on an absolute tear and is probably the first name picked for the AA side full stop. I haven’t seen much of Curnow though. I think Joe could make it as the third tall in the pocket, but he could compete with smaller forwards like Charlie and Greene since it’s not guaranteed to a tall.

In the end though the positive thing is that Joe doesn’t give a shit. He doesn’t listen to the media and I would assume he gives zero shits about being an All Australian again since it’s just another form of media award. He will just keep playing with or without the media recognition.


Sent from my iPhone using BigFooty.com
 

(Log in to remove this ad.)

To be entirely fair I have watched a fair bit of Geelong and Jeremy Cameron is on an absolute tear and is probably the first name picked for the AA side full stop. I haven’t seen much of Curnow though. I think Joe could make it as the third tall in the pocket, but he could compete with smaller forwards like Charlie and Greene since it’s not guaranteed to a tall.

In the end though the positive thing is that Joe doesn’t give a s**t. He doesn’t listen to the media and I would assume he gives zero shits about being an All Australian again since it’s just another form of media award. He will just keep playing with or without the media recognition.


Sent from my iPhone using BigFooty.com
I dont disagree re: Cameron as much as I hate saying it about the thug.
 
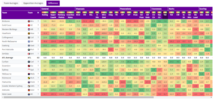
Have found a new site that has really useful team comparisons pretty easy to see - AFL Team Statistics

Here's a page showing the statistical differentials on things like possessions, clearances, etc (and fantasy points for those interested)

1683245009980.png


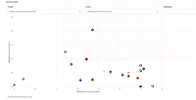
You can also use this site to create quick graphs - like the one below that looks at the number of contested defensive one on ones, and contested defensive one on one loss rates:

1683245113271.png


This is actually a really positive chart to me - our loss rate is very good, but the main thing is that our number of defensive one on one contests is just below competition average. Last year we were allowing far too many one one opportunities - here's the 2022 chart where we were conceding the second most in the comp.


1683245334604.png

Overall I think this adds to the picture that we are seeing a much better team defensive structure, with the caveat that it is only round 8 and we haven't played all the other teams yet. But an approximate reduction of 5 defensive one on ones per game is a pretty big change!
 
Last edited:
Have found a new site that has really useful team comparisons pretty easy to see - AFL Team Statistics

Here's a page showing the statistical differentials on things like possessions, clearances, etc (and fantasy points for those interested)

View attachment 1678401


You can also use this site to create quick graphs - like the one below that looks at the number of contested defensive one on ones, and contested defensive one on one loss rates:

View attachment 1678403


This is actually a really positive chart to me - our loss rate is very good, but the main thing is that our number of defensive one on one contests is just below competition average. Last year we were allowing far too many one one opportunities - here's the 2022 chart where we were conceding the second most in the comp.


View attachment 1678404

Overall I think this adds to the picture that we are seeing a much better team defensive structure, with the caveat that it is only round 8 and we haven't played all the other teams yet. But an approximate reduction of 5 defensive one on ones per game is a pretty big change!
Wow that team comparison chart is excellent to look at. Really interesting to see how it shows our style is very different to the other "good" teams. They tend to be green across the board, but we very clearly play a markedly different low handball/disposal game to every other contender
 
Have found a new site that has really useful team comparisons pretty easy to see - AFL Team Statistics

Here's a page showing the statistical differentials on things like possessions, clearances, etc (and fantasy points for those interested)

View attachment 1678401


You can also use this site to create quick graphs - like the one below that looks at the number of contested defensive one on ones, and contested defensive one on one loss rates:

View attachment 1678403


This is actually a really positive chart to me - our loss rate is very good, but the main thing is that our number of defensive one on one contests is just below competition average. Last year we were allowing far too many one one opportunities - here's the 2022 chart where we were conceding the second most in the comp.


View attachment 1678404

Overall I think this adds to the picture that we are seeing a much better team defensive structure, with the caveat that it is only round 8 and we haven't played all the other teams yet. But an approximate reduction of 5 defensive one on ones per game is a pretty big change!

Something I missed in my look at this because I didn't realise there were more data fields to the right (can't see them in my screenshot) - you can see tackle differential, tackle inside 50 differential and total pressure acts differential in the chart on the website: AFL Team Statistics

  • We are dead last in tackles per game, and bottom 5 in tackles inside 50 per game
  • However, against us our opponents are reasonably low in tackles per game and tackles inside 50 per game (6th in these stats) - this tells me that the games we play are generally low tackle, which probably means that our gamestyle influences that (less handballing by us = less tackles for them)
  • We average the lowest pressure acts against us and are above average for pressure acts (7th) - again, that points to our gamestyle making it hard to pressure us
  • We have the highest pressure act differential, avergaing 43 pressure acts per game more than our opponents.
I have two thoughts on this - one is that Dunkley probably accounts for most of this stat on his own as he's one of the top few in the comp. The second is that I don't think tackle counts are that relevant for us given our gamestyle being so different from other teams, and we are getting value out of pressuring the opposition e.g. by smothers, cutting off handball chains, etc.
 
Why hasn't David King and his Champion Data array of footy statistical experts picked up on the way we are playing this season?

The Pommies have Bazball, we've had Clarkoscluster, the Wallaceflood and PagansPaddock..... now we have Faglessismorefooty.:D
 
Why hasn't David King and his Champion Data array of footy statistical experts picked up on the way we are playing this season?

The Pommies have Bazball, we've had Clarkoscluster, the Wallaceflood and PagansPaddock..... now we have Faglessismorefooty.:D

Because we aren't a Victorian team.

Embrace it... The longer folks take to twig, the less likely we need to change.
 
Does the increase in 1 on 1 opportunities reflect our midfield getting roled last year at times (ie our defence didn’t have time to properly set because of no pressure upfield or oppo players streaming out of the square unchecked) or is it indicative of a structural thing?
 
Also, perhaps more seriously, we are only 4th, our percentage is ok without being outstanding and neither our attacking or defensive numbers are off the charts in either direction.

So any trends in our game style they HAVE picked up are probably considered short term anomalies.

OR they are waiting for us to cop an(other) absolute hiding so they can come out and say that all those trends they have picked up are unsustainable and can't win us a flag.
 
Does the increase in 1 on 1 opportunities reflect our midfield getting roled last year at times (ie our defence didn’t have time to properly set) or is it indicative of a structural thing?
I think Tom14 was suggesting we've had a lot less one on one defensive contests this year, not more?
 
I think Tom14 was suggesting we've had a lot less one on one defensive contests this year, not more?

Sorry poor phrasing by me.

Some would see that stat as being reflective of a structural change to our defence. I’m wondering whether (last year) we had a higher number of 1 on 1s because our midfield was defective and this year we are seeing a lower number because of Dunks (first and foremost).
 
Sorry poor phrasing by me.

Some would see that stat as being reflective of a structural change to our defence. I’m wondering whether (last year) we had a higher number of 1 on 1s because our midfield was defective and this year we are seeing a lower number because of Dunks (first and foremost).
I think so. We're seeing opposition teams forced to kick the ball on players' heads against us this season. Often big packs of 4 or 5 players.

I wouldn't put it all down to Dunkley but certainly we have been better organised defensively in midfield. SO FAR.
 
I think so. We're seeing opposition teams forced to kick the ball on players' heads against us this season. Often big packs of 4 or 5 players.

I wouldn't put it all down to Dunkley but certainly we have been better organised defensively in midfield. SO FAR.
Only seen one live game so far (which was the dogs game and not the best example). But from tv we definitely seem to be setting up different and the ball has been slower coming in. We seem to have been getting men across to assist more often than last year once it does get into the back 50.

But at the same time its not necessarily men at the contest (hence lowish tackle numbers?), we seem to be sitting back to cut-off the handball happy teams.

The more I think about it, we may be ahead of the trend for defensive game plans this year (not something I expected). We have well matched the style of the top couple of teams
 
Status
Not open for further replies.

Remove this Banner Ad

Remove this Banner Ad

Back
Top