Analysis Season 2023 - Statistics and Analytics Thread

Remove this Banner Ad

Status
Not open for further replies.
Something I missed in my look at this because I didn't realise there were more data fields to the right (can't see them in my screenshot) - you can see tackle differential, tackle inside 50 differential and total pressure acts differential in the chart on the website: AFL Team Statistics

  • We are dead last in tackles per game, and bottom 5 in tackles inside 50 per game
  • However, against us our opponents are reasonably low in tackles per game and tackles inside 50 per game (6th in these stats) - this tells me that the games we play are generally low tackle, which probably means that our gamestyle influences that (less handballing by us = less tackles for them)
  • We average the lowest pressure acts against us and are above average for pressure acts (7th) - again, that points to our gamestyle making it hard to pressure us
  • We have the highest pressure act differential, avergaing 43 pressure acts per game more than our opponents.
I have two thoughts on this - one is that Dunkley probably accounts for most of this stat on his own as he's one of the top few in the comp. The second is that I don't think tackle counts are that relevant for us given our gamestyle being so different from other teams, and we are getting value out of pressuring the opposition e.g. by smothers, cutting off handball chains, etc.

Low pressure acts against also is from a low handball game I’d assume since you generally get one if you are chasing or corralling the opposition with the ball. Since there’s less handballs/change in possession there’s less opportunity for the opposition to earn a pressure act.


Sent from my iPhone using BigFooty.com
 
Why hasn't David King and his Champion Data array of footy statistical experts picked up on the way we are playing this season?

The Pommies have Bazball, we've had Clarkoscluster, the Wallaceflood and PagansPaddock..... now we have Faglessismorefooty.:D

We aren’t fagless while I’m here ;p


Sent from my iPhone using BigFooty.com
 
Great pickup by everyone here, I have been pulling my numbers from those Wheelo rating Tom14 so I guess my secret is out! Maybe you can start feeding me the talking points so I can build myself a David King like level of respect across the board. ;)

Otherwise great insights, especially about pressure acts. We seem to be playing some kind of game style the Champion Data hasn't really been able to track yet, what we are doing is causing turnovers but isn't really appearing in our "pressure rating". I have been trying to see if a star pops out to support this, mostly too see if our turner over differential was much higher but didn't see much of it. Maybe if we could see data on WHERE those turnovers occurred in comparison to our opposition, we would have a bit more insight. I would hazard a guess we are generating a lot of turnovers forward of center as teams try to handball past us, while most of our turnovers are in our forward half aswell through either poor delivery to our forwards, or not having enough players forward of the ball as we are pushing back harder.

The other part of our gameplay that I think was picked up here is our clearance differential. We are something like +7-8 a game over our opposition, and that includes a drubbing where we didn't turn up in the first round. Even our center square differentials are looking alot more even, and personally I attribute some of this to the coaches mixing up our midfield to match the opponents on the day. That is probably also making us hard to predict for opposition coaches as well. As someone who was very critical of our coaching from previous seasons when we were talking about it here, I'm starting to have to look at eating my own hat.
 

Log in to remove this ad.

Sorry poor phrasing by me.

Some would see that stat as being reflective of a structural change to our defence. I’m wondering whether (last year) we had a higher number of 1 on 1s because our midfield was defective and this year we are seeing a lower number because of Dunks (first and foremost).

It could be either. Up until the giants game we were also conceding the second least points from transitions out of our forward 50 as well, but GWS got a lot of second half goals that way which blew the stat out a bit and we are around average now.


That to me says we are structured up a bit better but it’s probably a combo of both.
 
Just having a look at last qrt scores against:

Port - 2.1
Melb - 1.4
Dogs - 1.3
Pies - 4.2
North - 5.7
Giants - 2.7
Freo - 4.3
Carlton - 3.1

We've lost 5 out of 8 of those last quarters - certainly not out strongest.
No ideal how it compares to other clubs.
 
is there somewhere that list scores per quarter?

We may be last on the last quarter ladder

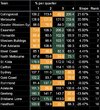
I keep a record of this. Not so much wins and losses... More raw %'s. This is how it stood after Round 7:

Screenshot_20230507_052255_Sheets.jpg

Slope basically means "if you draw a line of best fit through each of the %'s for each quarter, a team's percentage changes by that amount each quarter". So our percentage falls by 15% on average each quarter.
 
I keep a record of this. Not so much wins and losses... More raw %'s. This is how it stood after Round 7:

View attachment 1680443

Slope basically means "if you draw a line of best fit through each of the %'s for each quarter, a team's percentage changes by that amount each quarter". So our percentage falls by 15% on average each quarter.
Great info Grasshopper, you would think this drop off is more a mental issue than a fitness issue.
 
I think a big issue with us running out games is lack of midfield depth. Too much of the load goes onto Dunks, Neale and Oscar. Fort has been ok when he's played, Ashcroft has had a few good games but with Clug being so terrible this year, our wingers not influencing the game and our part time mids not really making an impact our midfield hasn't found enough consistency

Hopefully the tide is turning on Clugs and others form
 
Something I missed in my look at this because I didn't realise there were more data fields to the right (can't see them in my screenshot) - you can see tackle differential, tackle inside 50 differential and total pressure acts differential in the chart on the website: AFL Team Statistics

  • We are dead last in tackles per game, and bottom 5 in tackles inside 50 per game
  • However, against us our opponents are reasonably low in tackles per game and tackles inside 50 per game (6th in these stats) - this tells me that the games we play are generally low tackle, which probably means that our gamestyle influences that (less handballing by us = less tackles for them)
  • We average the lowest pressure acts against us and are above average for pressure acts (7th) - again, that points to our gamestyle making it hard to pressure us
  • We have the highest pressure act differential, avergaing 43 pressure acts per game more than our opponents.
I have two thoughts on this - one is that Dunkley probably accounts for most of this stat on his own as he's one of the top few in the comp. The second is that I don't think tackle counts are that relevant for us given our gamestyle being so different from other teams, and we are getting value out of pressuring the opposition e.g. by smothers, cutting off handball chains, etc.

I have no stats but an observation that when we were all trying to tackle we mostly missed them, fell over and the opposition easily got away from us.

Much prefer that many players now go for pressure and cause turnovers, and leave the full on tackling to those who can make them stick.

Much less shaking my first at the tv.
 

(Log in to remove this ad.)

I have no stats but an observation that when we were all trying to tackle we mostly missed them, fell over and the opposition easily got away from us.

Much prefer that many players now go for pressure and cause turnovers, and leave the full on tackling to those who can make them stick.

Much less shaking my first at the tv.

It's a huge help in this regard when two blokes don't rush in for same tackle. How many times would we see a 2 on 2, both our guys run in to the ball carrier and create a 1 on 0 for the ball carrier to give over the top to.

We are now either no longer doing this or far more judicious in doing so.

By the way I'd point out that I see this happen LOTS of times each round, so it's hardly a Lions-only issue. I suspect this comes back to the fact that AFL level players have always played in a "see ball, get ball" manner, and it requires incredible self-discipline and trust in your team mate to change that lifetime habit.

Another side benefit is that when two blokes don't rush in for the same tackle, the 2nd bloke has a greater opportunity to... You guessed it... INTERCEPT THE HANDBALL!
 
I keep a record of this. Not so much wins and losses... More raw %'s. This is how it stood after Round 7:

View attachment 1680443

Slope basically means "if you draw a line of best fit through each of the %'s for each quarter, a team's percentage changes by that amount each quarter". So our percentage falls by 15% on average each quarter.
It's also possible that this, which such a strong showing in the first half, is giving us data points of we are doing more then enough to win games and then easing off to prepare for the next week.

I might be giving them the benefit of the doubt there though haha.
 
I keep a record of this. Not so much wins and losses... More raw %'s. This is how it stood after Round 7:

View attachment 1680443

Slope basically means "if you draw a line of best fit through each of the %'s for each quarter, a team's percentage changes by that amount each quarter". So our percentage falls by 15% on average each quarter.

Chicken and egg but we have played 6 of the top 7
 
It's also possible that this, which such a strong showing in the first half, is giving us data points of we are doing more then enough to win games and then easing off to prepare for the next week.

I might be giving them the benefit of the doubt there though haha.
We definitely try to shut down games super early, if we look to have the game won.
 
We definitely try to shut down games super early, if we look to have the game won.
There was a noticeable shift in the Collingwood game about mid way through the 3rd quarter that we tried to slow the game down as much as possible.
It didn’t necessarily backfire but it did allow them to work their way back into it which BT was all over.
 
There was a noticeable shift in the Collingwood game about mid way through the 3rd quarter that we tried to slow the game down as much as possible.
It didn’t necessarily backfire but it did allow them to work their way back into it which BT was all over.
Every time the instruction's gone out from the bench to slow the game down either during the game or nearer the end the players seem to relax mentally ,stop running , the opposition gets a sniff with a goal or two and we need to wrest momentum back.

I'm not saying it's the wrong thing to do necessarily ,just an observation that it has the potential to backfire and it gives me palpitations whenever we do it.

My view is that we have enough experienced players out there around the ball who will instinctively know when it's time to slow it down and you're better off letting them take ownership of the situation. Placards and hand waving from the bench sends a message to all players and some of them overdo the tactics.
 
Can’t remember where I heard it recently, but someone like Hodge recently said champion teams don’t take their foot off the gas and bury teams.

We don’t do this.
I think it would be a little premature if at all to call us a champion team.

Aspiring to be a champion team doesn't mean you think you can do what they do.

Fwiiw I'm not a fan of taking the foot off the gas at all.
 
Can’t remember where I heard it recently, but someone like Hodge recently said champion teams don’t take their foot off the gas and bury teams.

We don’t do this.
We are not yet a champion team.
But I am still hoping we will be.
 
Last year Geelong had 3 ten goal wins and 2 around 100 points, we had 2, 10+ goal wins (75 and 108)
In 2021; Melbourne had one win over 10 goals (about 100 vs suns), we had 4
In 2020; Richmond had one 10 goal win, 3 in the 40s (Covid season), we had 1 and 1
In 2019; Richmond had 3, 10+ goal wins, we had 2
In 2018; Richmond had 4, 10+ goal wins

We also had he best percentage of any team in 2021
 
Last edited:
Last year Geelong had 3 ten goal wins and 2 around 100 points, we had 2, 10+ goal wins
In 2021; Melbourne had one win over 10 goals (about 100 vs suns), we had 4
In 2020; Richmond had one 10 goal win, 3 in the 40s (Covid season), we had 1 and 1
In 2019; Richmond had 3, 10+ goal wins, we had 2
In 2018; Richmond had 4, 10+ goal wins

So over the last 4 years the premiers have had 13 big wins, we’ve had 10
 
Status
Not open for further replies.

Remove this Banner Ad

Remove this Banner Ad

Back
Top