Analysis Season 2023 - Statistics and Analytics Thread

Remove this Banner Ad

Status
Not open for further replies.
The corralling works well if and only if you're also putting pressure on their outlet players. If you don't it's basically an easy transition from one end to the other, and in previous years when we'd corral we didn't have the backup from other players. In our best games you can see the difference - the corralled player takes the "easy" out, who is immediately wrapped up.

Tackling has a lot more good results but a lot more bad results too (free kick, broken tackle given how poor some of our players are at it, player given 30 seconds to dispose of the ball even after hitting the ground allowing an overlap to form)...

The moment against the Saints where McCluggage tackles a player, purposely doesn't drive him to the ground and the umpire does not give him the free is the perfect example of what's wrong with modern era tackling. All too common.

Agree that the best balance of a mix of the two, but imo tackling to create a stoppage or get HTB is ideal then coral with pressure to create turnovers.
 
The corralling works well if and only if you're also putting pressure on their outlet players. If you don't it's basically an easy transition from one end to the other, and in previous years when we'd corral we didn't have the backup from other players. In our best games you can see the difference - the corralled player takes the "easy" out, who is immediately wrapped up.

Tackling has a lot more good results but a lot more bad results too (free kick, broken tackle given how poor some of our players are at it, player given 30 seconds to dispose of the ball even after hitting the ground allowing an overlap to form)...

The last 2 games I noticed one occasion each game where both our players went for the ball carrier leaving someone free which looked like it was a miscommunication or mistake by our players. The fact that it stood out just shows that it's something that we're doing really well this year.
 
The last 2 games I noticed one occasion each game where both our players went for the ball carrier leaving someone free which looked like it was a miscommunication or mistake by our players. The fact that it stood out just shows that it's something that we're doing really well this year.
Yes. This was very common in our Hawthorn and Port games this year, and most games last year, but not so much in our other games. This is quite common across the league, and I imagine it takes a great deal of discipline for players at the highest level to train themselves to NOT always "see ball get ball", given that's how they would have played all their footy growing up. Discipline, and trust in your team mate also. That trust is more easily earned when you can be relied upon to stick your tackles! Which is still not always our strong suit.
 

Log in to remove this ad.

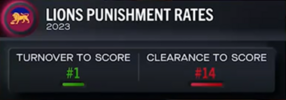
Finally a couple of useful tidbits out of this week's champion data and David King data dump - focusing on our scoring profile:

1688538726361.png
1688538794397.png
  • The best part of 1 in 4 turnovers we generate go on the scoreboard, and the AFL average is 1 in 5 or 1 in 6.
  • This is the best rate since Adelaide in 2016.
  • While our score from clearance numbers are down this year, turnover is a much more sustainable way to score - and there is a lot of scope for improvement for us there.
1688538890697.png


Some other points raised without graphics:
  • We've scored 70 points more off the back of midfield intercepts than anyone in the competition - i.e. intercepts between the arcs.
  • We are also #5 for generating those intercepts.
  • Harris Andrews's intercepts alone have led to 70 points on the rebound, #1 in the competition ahead of Darcy Moore.
  • In addition to Harris, Neale, Starce and Wilmot are also in the top 10 for turning intercepts between the arcs into scores - so we have 4 of the top 10 in that category.
Overall to me it suggests that while we can do more scoring wise from clearance, the balance of our scoring is so much better than it has been and sets us up better for finals.
 
Most scores are from turnovers so fantastic to be number 1 in that area of the game.

Could our drop in scores from clearances be because of our defensive set ups now.
 
Champion Data's weekly segment on SEN today Lions are >

Number 1 in the AFL for time in the forward half.
Number 1 in the AFL for clearances.
Number 2 in the AFL for turning possession into a score.
3rd hardest in the AFL to turn possession into a score.
Number 1 in the AFL for D50 to F50 chains.
_____________________________________

They have only seen numbers as good as this for 2 sides in the last 20 years, Cats last year and Cats in 2007.

Then why have we lost twice as many games as Collingwood and Port?

My assumption would be the GAO between our best and worst is larger than them

Plus goal kicking in the Crows game
 
Then why have we lost twice as many games as Collingwood and Port?

My assumption would be the GAO between our best and worst is larger than them

Plus goal kicking in the Crows game
Not sure.

Another thing he mentioned was that we are the most even team in the competition ie. we spread the load between the players on the ground and don't rely on a small number of individuals, mentioned Lachie Neale being down statistically but only because we spread the possessions out now, Dunkley and Ashcroft coming in.

We only have 1 player in their statistical top 50 players in the competition which his Harris Andrews in 27th IIRC.
 
Then why have we lost twice as many games as Collingwood and Port?

My assumption would be the GAO between our best and worst is larger than them

Plus goal kicking in the Crows game

We lost against Adelaide because we didn’t convert the right score - too many behinds.
Port and Hawthorn are completely irrelevant to our flag hopes.
Bulldogs was just a loss to a decent team. Which happens.
 
Champion Data's weekly segment on SEN today Lions are >

Number 1 in the AFL for time in the forward half.
Number 1 in the AFL for clearances.
Number 2 in the AFL for turning possession into a score.
3rd hardest in the AFL to turn possession into a score.
Number 1 in the AFL for D50 to F50 chains.
_____________________________________

They have only seen numbers as good as this for 2 sides in the last 20 years, Cats last year and Cats in 2007.
Yeah I'm taking all this with a grain of salt. While it was all very nice to hear, a lot of his analysis was "in the last 6 weeks". Our last 6 games (4 wins, 2 losses) have featured only 1 team in the top 8, the hardly in form St Kilda.

I think a lot of this (very excellent) analysis Champion Data does needs to be better weighted by who has a team played in that time. For example, we are "number 1 for time in forward half"... But what if we just so happen to have played the bottom 6 sides in the comp during that time for "time in forward half"... I think then the data output should be offset for that accordingly.

I very much doubt this is happening at present because this stuff is already complicated enough. But at some stage in future years it will happen because at least one team will realise they can get some leverage out of being able to "see through" the data.


For what it's worth I do something similar with match results... Whilst I don't take into account home ground advantage (I probably should, but home ground advantage is very different for various teams), I look at a team's for and against records, balance that up with who they have played, and convert the score from each game to "what would the score have been against a team with an average attack and an average defence".

For example, our loss 78-95 to Adelaide actually converts to a 76-68 win against an "average" team, because Adelaide has a pretty average defence but an above average attack. On the flipside, Adelaide's performance in that game equates to a 124-51 win against an "average" team, because our attack is rated the best in the league and our defence is also rated "above average".

Over the course of the season you can weigh up all the "effective scores" and give a team an "effective percentage". In a league where some teams have played other teams twice, while not playing other teams at all yet, it can be quite interesting to see the discrepancies between that and their actual percentage.

At the moment the most notable discrepancy I have is Richmond, who I rate at 108.6% relative to their actual % of 96.9. This is because they haven't played Hawthorn or North at all yet, while they've already played Sydney twice, who are rated over 100 (like their actual %).
 
Last edited:
Champion Data's weekly segment on SEN today Lions are >

Number 1 in the AFL for time in the forward half.
Number 1 in the AFL for clearances.
Number 2 in the AFL for turning possession into a score.
3rd hardest in the AFL to turn possession into a score.
Number 1 in the AFL for D50 to F50 chains.
_____________________________________

They have only seen numbers as good as this for 2 sides in the last 20 years, Cats last year and Cats in 2007.
That last stat is a direct result of the fact that our defence has so much run and rebound capacity. Exiting our 50 we have no more slowing the game down, assessing options, waiting till we are all manned up and then kicking it down the line to a contest. Wilmot, Coleman, McKenna and Lester have provided rebound and a willingness to run both ways hard if they are up the field.
 
That last stat is a direct result of the fact that our defence has so much run and rebound capacity. Exiting our 50 we have no more slowing the game down, assessing options, waiting till we are all manned up and then kicking it down the line to a contest. Wilmot, Coleman, McKenna and Lester have provided rebound and a willingness to run both ways hard if they are up the field.
Spot on, and when he is playing Richy is the main offender of the bolded.
 

(Log in to remove this ad.)

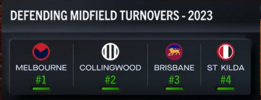
This week's champion data update - looking at defending turnovers between the arcs (midfield here refers to the space on the ground between the arcs, not turnovers by midfielders):

1689145145797.png

A few points:
  • Turnovers between the arcs account for about 40% of scoring across the competition
  • Its a much better profile for us than in previous years, and the last few premiers have been top 4 in this category
  • We also have the best points differential from midfield turnovers at +214 - quite a fair bit ahead of Melbourne at +169 and Collingwood at +134. Port lag further behind at +90.

Some further stuff on Harris (note the graphic refers to Champion Data's new pseudoscientific 100x ratings system which has Michito Owens as the best player in the comp, and is only over the last 6 weeks so take it with a grain of salt):

1689145606324.png

  • More interesting was the stat that Harris has the most intercept marks taken between the arcs - ahead of Balta and Darcy Moore.
  • Payne has taken the 5th most intercept marks inside D50.
 
Then why have we lost twice as many games as Collingwood and Port?

My assumption would be the GAO between our best and worst is larger than them

Plus goal kicking in the Crows game

Collingwoods gone 3-1 in games decided by 6 points or less, Port has gone 5-0 in games decided by 7 points or less.

We haven’t played a single game with that tight a margin (dogs game had a kick on the siren to take it out of that range I think).

You can run the argument that the Pies and Port tRaIN tHe ClOSe gAMEs but given the pies lost close finals last year and port went 0-5 in them last year I reckon luck has a fair bit to do with it.
 
Post Round 18 Stats
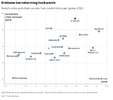
Season long expected scores against - Opponents have scored more compared to expectation against us than any other team. To be fair the most recent Dees game pushed us 'ahead' of Port but even if Melbourne had kicked to expectation on Friday night we would be 15th in the comp.


xS-Against.jpg


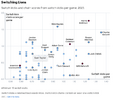
Here's an interesting graphic on shot quality from twitter as well - the higher on the vertical axis, the better quality open play shots you have (e.g. a shot running into an open goal square would have a very high xscore), and the further right on the horizontal axis the better quality set shots generated:


The size of the dot indicates the number of shots (us and Adelaide lead the comp with around 460 shots).
 

Attachments

  • xS-Against.webp
    180 KB · Views: 22
Wow I wonder if thats just a random chance thing or if there is some other factor about how we defend or something? Would be great to see a couple of years of that analysis to see whats gong on there

I dont know if I am upset by being the worst if its random chance. At some point things should revert to the mean and teams should swing the other into inaccuracy. Hopefully in finals

I think that question is hard to answer. The herald sun/champion data metric claims that open play shots are rated by location and 'pressure' - but how they calculate that is a blackbox.

Earlier this year the Saints were big beneficiaries from their opposition missing set shots compared to expectation, which are a bit cleaner to analyse given that there isn't any physical pressure to them.

In terms of our defensive profile, you could look at the set shot quality we give up potentially as a raw expected score against figure and compare it to the rest of the competition but I don't have numbers for round 18 on that compared to the rest of the comp. Earlier in the year we were in the top 5-6 teams in terms of expected score against (i.e. our expected score against was pretty low).

Generally accuracy is something that varies a fair bit - we were dreadful in 2020 but pretty much top in 2021 and 2022 and I don't think an opposition's accurcy against us would be any different. Sadly no guarantee this changes in a final though!
 
I tried to find it myself this morning with no luck, but is there any way to locate what teams average per game in terms of kms run? Or even a game by game basis? Tom14
 
I tried to find it myself this morning with no luck, but is there any way to locate what teams average per game in terms of kms run? Or even a game by game basis? Tom14
I think if you are with Telstra on the AFL app you can see individual player GPS numbers for a game? I've been with a different phone carrier the last 5-6 years so I've never been able to see them.

Broader team numbers I don't know if there is a handy single list sadly.
 
Damn we've come a long way from those years where a switch meant a terrible turnover goal about half the time.
The big improvement these days is having players who can actually kick a ball relatively well. It's still a delight at times.
 
After cracking the sh!ts on Friday night and over the weekend, I went back and crunched the numbers on our dynasty team(s).

In 2001, we had a Q4 % of 164, making it not only our best quarter (our second best quarter was Q2, at just 129.9), but also, we were the best Q4 team in the comp. Carlton were 2nd with 153.8. Yes Carlton were decent in 2001.

In 2002, we slackened off a bit with our last quarters. Our Q4 % fell to 147.9. But it was still our best quarter (Q1 146.0), AND we were STILL the best Q4 team in the comp, by some distance (Sydney 126.9).

In 2003, those of us old enough will remember we had all sorts of problems with injuries and general player fitness. 2 years of every other team coming after us seemed to be taking its toll. Yet, despite that we still had a Q4 % of 137, and it was STILL our best quarter. We also remained the best Q4 team in the comp, ahead of Port on 135.3.

In 2004, father time caught up with us tho, as our Q4 % dropped to 127.1 and was only our third best quarter. We were also only the third best Q4 team, behind Port and Melbourne.

So you can see that being a strong Q4 team, or, as I like to put it, the fittest team in the comp, played a huge part in our success.

But that was 20 years ago! Footy's changed, right?

Wrong. The more things change, the more things change the same.

2022: Geelong had a Q4 % of 161.6. Easily the best Q4 team in the comp (Sydney 132.1 were closest), and it was also their best quarter, their next best being Q2 at 154.7. Yep, this is dad's army Geelong we're talking about here. Too old, too slow, too fit.

2021: Melbourne had a Q4 % of 161.5. it was comfortably the best Q4 % in the comp (ahead of the Bulldogs 146.8) but funnily enough it wasn't even their best quarter. They had a Q3 % of 182.6 which over the course of a whole season is quite staggering.

So it's more than just aesthetics which have us (and me in particular) wanting us to finish games off properly... It turns out it's a actually a key factor in premiership success.

Currently our Q4 % is just 101.1. It's our worst quarter by quite some distance (our second worst quarter is Q1 at 127.7). This also ranks us 9th in terms of last quarter %'s, behind teams like the Giants (128.9), St Kilda (112.8), Carlton (112.1) and Geelong (105.1). Collingwood and Melbourne are way off in the distance at 169.3 and 157.9 respectively.

So the why's and wherefores are kind of irrelevant, but whatever the reasons, we are well off the pace in this regard, and may well be out of time to be able to do anything about it in season 2023.
 
Status
Not open for further replies.

Remove this Banner Ad

Remove this Banner Ad

Back
Top