This system hates MaxFor those who want a summary of how the ratings work without reading a 200 page academic paper. https://credittodubois.com/blog/worked-example-of-player-ratings-fre-v-mel-r19-2024
Navigation
Install the app
How to install the app on iOS
Follow along with the video below to see how to install our site as a web app on your home screen.
Note: This feature may not be available in some browsers.
More options
You are using an out of date browser. It may not display this or other websites correctly.
You should upgrade or use an alternative browser.
You should upgrade or use an alternative browser.
Analysis Crows Player Ratings
- Thread starter Interloperer
- Start date
- Tagged users None
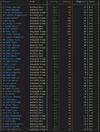
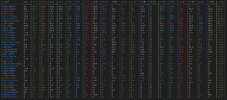
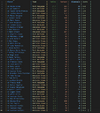
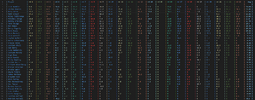
Yes he seems to be the outlier among our players in terms of the ratings he gets. Apart from that I find it a pretty reasonable metric and definitely better than the pure fantasy points / disposals type approach.This system hates Max
Golumless
A bigger deal out west.
Seeing this is the champion data love-in page, Jordan Dawson
is currently the 6th worst kick going into inside 50 in the competition (via SEN).
PLAYERCARDSTART
12
Jordan Dawson
- Age
- 27
- Ht
- 191cm
- Wt
- 91kg
- Pos.
- Mid
Career
Season
Last 5
- D
- 17.0
- 4star
- K
- 11.4
- 4star
- HB
- 5.7
- 4star
- M
- 4.8
- 5star
- T
- 2.8
- 4star
- CL
- 0.6
- 3star
- D
- 15.7
- 4star
- K
- 10.9
- 4star
- HB
- 4.9
- 3star
- M
- 2.9
- 3star
- T
- 2.0
- 3star
- CL
- 0.4
- 3star
- D
- 11.8
- 3star
- K
- 7.8
- 3star
- HB
- 4.0
- 3star
- M
- 5.0
- 5star
- T
- 3.0
- 5star
- CL
- 0.6
- 3star
PLAYERCARDEND
- Aug 5, 2013
- 2,660
- 2,372
- AFL Club
- Adelaide
- Thread starter
- #154
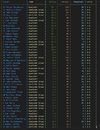
Pure Class Ratio: Josh Rachele (0.31)
Quantity Over Quality: Darcy Fogarty
PLAYERCARDSTART
32
Darcy Fogarty
- Age
- 25
- Ht
- 194cm
- Wt
- 100kg
- Pos.
- Fwd
Career
Season
Last 5
- D
- 8.5
- 2star
- K
- 5.7
- 2star
- HB
- 2.8
- 2star
- M
- 3.7
- 4star
- T
- 1.7
- 4star
- G
- 1.2
- 4star
- D
- 6.3
- 1star
- K
- 4.0
- 1star
- HB
- 2.3
- 2star
- M
- 3.0
- 3star
- T
- 2.3
- 3star
- G
- 1.0
- 4star
- D
- 8.0
- 2star
- K
- 5.4
- 2star
- HB
- 2.6
- 3star
- M
- 3.4
- 4star
- T
- 2.6
- 4star
- G
- 1.0
- 4star
PLAYERCARDEND
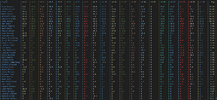
Not sure many people would concur that Rachele was better than Day… 

- Aug 5, 2013
- 2,660
- 2,372
- AFL Club
- Adelaide
- Thread starter
- #156
Golumless
A bigger deal out west.
Nothing against the poster but you know the system is hot garbage when Zac Taylor is rated our 7th worst today, and Laird is consistently amongst our highest rated.
Not really. A low disposal count and a sub 50% kicking efficiency usually don't mix too well in these ratings. Especially if you pair it with really bad score/xscore rating (as these ratings really punish missing what it deems as easy shots at goal, and Taylor recorded at -6.1), and not getting involved in scoring chains (Taylor had 0 GA/1 SI/0 SL).
Equally, Laird being rated at top 100 player levels (currently 61st) isn't surprising, or indicative of a poor rating system. The opposite really as it should be rewarding guys who win a lot of ball and use it safely (which Laird does as he's going at 27.1 disposals/73.7% efficiency). You worry when these guys end up in the top 20 or so, seeing it might be overselling the whole ball winning angle, but a 60ish rating seems fair seeing you have to rate ball winning highly to even have a remotely effective measure.
- Aug 5, 2013
- 2,660
- 2,372
- AFL Club
- Adelaide
- Thread starter
- #159
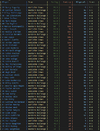
Pure Class Ratio: Darcy Fogarty
PLAYERCARDSTART
32
Darcy Fogarty
- Age
- 25
- Ht
- 194cm
- Wt
- 100kg
- Pos.
- Fwd
Career
Season
Last 5
- D
- 8.5
- 2star
- K
- 5.7
- 2star
- HB
- 2.8
- 2star
- M
- 3.7
- 4star
- T
- 1.7
- 4star
- G
- 1.2
- 4star
- D
- 6.3
- 1star
- K
- 4.0
- 1star
- HB
- 2.3
- 2star
- M
- 3.0
- 3star
- T
- 2.3
- 3star
- G
- 1.0
- 4star
- D
- 8.0
- 2star
- K
- 5.4
- 2star
- HB
- 2.6
- 3star
- M
- 3.4
- 4star
- T
- 2.6
- 4star
- G
- 1.0
- 4star
PLAYERCARDEND
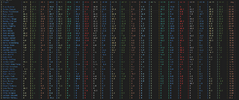
Quantity Over Quality: Nick Murray (-0.02)
Scorpus
Moderator
- Apr 16, 2014
- 62,244
- 166,300
- AFL Club
- Adelaide
- Moderator
- #162
I cant believe English rated higher than ROB
I thought Lachie Sholl's touches had a higher value than the ratings gave him
Hitouts have virtually no correlation with winning, so they don't contribute much to most ranking systems
- Aug 5, 2013
- 2,660
- 2,372
- AFL Club
- Adelaide
- Thread starter
- #163
Only Hit outs to advantage (good) and sharked hit outs (very bad) sway the ratings in a significant manner.Hitouts have virtually no correlation with winning, so they don't contribute much to most ranking systems
FR0GGY
From a cartel villa in Tuscany
Where can you find out sharked hitout stats?Only Hit outs to advantage (good) and sharked hit outs (very bad) sway the ratings in a significant manner.
They were the two anomalies that stood out to me also - thought both had much greater impact than that.I cant believe English rated higher than ROB
I thought Lachie Sholl's touches had a higher value than the ratings gave him
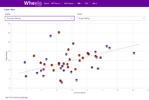
I love the Wheelo site and thought it was worth sharing this view using the same AFL ratings points. This shows not only the ratings points that all players actually scored but also plots what they were predicted to score (i.e. Bont is the best player and he had the highest (furthest to the right) expected score).
Take a look at the two Bulldogs players who were the furthest below the line indicating that they underperformed the most. They were Weightman and Naughton so I reckon our two defenders (Bond and whoever was on Naughton) deserve plaudits for how well they locked down on two potential matchwinners.
- Aug 5, 2013
- 2,660
- 2,372
- AFL Club
- Adelaide
- Thread starter
- #166
good question...Where can you find out sharked hitout stats?
deep in the Champion Data vault. It does have a glossary mention on theirs and the AFLs pages, but it isn't otherwise publicly viewable.
FR0GGY
From a cartel villa in Tuscany
I’d assume Rob had a heap of those given he had a heap of to advantage onesgood question...
deep in the Champion Data vault. It does have a glossary mention on theirs and the AFLs pages, but it isn't otherwise publicly viewable.
- Aug 5, 2013
- 2,660
- 2,372
- AFL Club
- Adelaide
- Thread starter
- #168
It depends where they are too. The total change in points depends on how much the hit out changed the situation of the game.I’d assume Rob had a heap of those given he had a heap of to advantage ones
(Quoting from memory, I can't remember the article I read this in. And these formulas generally aren't public)
A Hit out to advantage gives 2/3 of the credit to the ruck, and 1/3 to the rover. Sharked taps give 1/3 to the ruck as a negative, and 2/3 to the rover.
FR0GGY
From a cartel villa in Tuscany
Unbelievable how it all gets recordedIt depends where they are too. The total change in points depends on how much the hit out changed the situation of the game.
(Quoting from memory, I can't remember the article I read this in. And these formulas generally aren't public)
A Hit out to advantage gives 2/3 of the credit to the ruck, and 1/3 to the rover. Sharked taps give 1/3 to the ruck as a negative, and 2/3 to the rover.
- Aug 5, 2013
- 2,660
- 2,372
- AFL Club
- Adelaide
- Thread starter
- #170
Most of the hard work is in the location. Which is all thanks to GPS.Unbelievable how it all gets recorded
There is (or at least used to be) also a commentary feed that is purely statistics. The intro to the book "Footballistics" by James Coventry interweaves the transcript of the Channel 7 call of the 2015 AFL grand final with the Champion Data one in a way that I think it pretty neat.
- Aug 5, 2013
- 2,660
- 2,372
- AFL Club
- Adelaide
- Thread starter
- #171
- Aug 5, 2013
- 2,660
- 2,372
- AFL Club
- Adelaide
- Thread starter
- #172
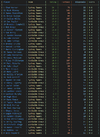
Pure Class Ratio: James Borlase (0.51)
Quantity Over Quality: Billy Dowling (0.03)
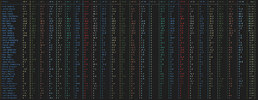
Congratulations to Izak Rankine
PLAYERCARDSTART
23
Izak Rankine
- Age
- 24
- Ht
- 181cm
- Wt
- 82kg
- Pos.
- Fwd
Career
Season
Last 5
- D
- 13.0
- 3star
- K
- 9.0
- 3star
- HB
- 4.0
- 3star
- M
- 2.7
- 3star
- T
- 2.7
- 4star
- G
- 2.0
- 5star
- D
- 13.0
- 3star
- K
- 9.0
- 4star
- HB
- 4.0
- 3star
- M
- 2.7
- 3star
- T
- 2.7
- 4star
- G
- 2.0
- 5star
- D
- 13.0
- 4star
- K
- 9.0
- 4star
- HB
- 4.0
- 3star
- M
- 2.7
- 3star
- T
- 2.7
- 5star
- G
- 2.0
- 5star
PLAYERCARDEND
His average was so far ahead that even scoring him 0.0 for the games he missed due to suspension, he only just finishes 2nd to Dawson by ~0.25
- Aug 5, 2013
- 2,660
- 2,372
- AFL Club
- Adelaide
- Thread starter
- #173
Incidentally, the dodgy "Callum Chambers
Award" formula actually did a good job this year.
round 14 vs Sydney Swans
-------------------------
Positive Anomaly: Joel Amartey - 28.30 (3.30 std dev. above average 6.12)
PLAYERCARDSTART
Callum Chambers
- Age
- 45
- Ht
- 184cm
- Wt
- 78kg
- Pos.
- M/F
Career
Season
Last 5
- D
- 11.5
- 3star
- K
- 7.4
- 3star
- HB
- 4.1
- 3star
- M
- 3.2
- 3star
- T
- 1.0
- 3star
No current season stats available
- D
- 10.6
- 3star
- K
- 6.4
- 3star
- HB
- 4.2
- 4star
- M
- 2.8
- 3star
- T
- 0.8
- 3star
PLAYERCARDEND
round 14 vs Sydney Swans
-------------------------
Positive Anomaly: Joel Amartey - 28.30 (3.30 std dev. above average 6.12)
thanks for your fine service my GView attachment 2090393
Pure Class Ratio: James Borlase (0.51)
Quantity Over Quality: Billy Dowling (0.03)
View attachment 2090395
Congratulations to Izak Rankine. The number 1 player rankings player when he can get on the field
His average was so far ahead that even scoring him 0.0 for the games he missed due to suspension, he only just finishes 2nd to Dawson by ~0.25
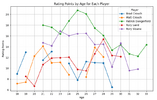
With Rory Sloane
retiring, here's how he compared to his fellow Crows midfielders.
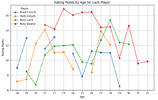
From 23-26 he was in the top 10 players in the league. Easily our best midfielder post Danger.

Not everyone can be Danger, unfortunate he left us for his peak from 25.
PLAYERCARDSTART
9
Rory Sloane
- Age
- 34
- Ht
- 183cm
- Wt
- 87kg
- Pos.
- Mid
Career
Season
Last 5
- D
- 23.7
- 5star
- K
- 11.7
- 4star
- HB
- 11.9
- 5star
- M
- 3.5
- 4star
- T
- 6.6
- 5star
- CL
- 5.7
- 5star
- D
- 15.3
- 4star
- K
- 7.3
- 3star
- HB
- 8.0
- 4star
- M
- 1.3
- 1star
- T
- 3.3
- 4star
- CL
- 4.2
- 5star
- D
- 22.2
- 5star
- K
- 8.6
- 4star
- HB
- 13.6
- 5star
- M
- 3.2
- 4star
- T
- 6.0
- 5star
- CL
- 4.6
- 5star
PLAYERCARDEND

From 23-26 he was in the top 10 players in the league. Easily our best midfielder post Danger.

Not everyone can be Danger, unfortunate he left us for his peak from 25.


