Stats questions

Remove this Banner Ad

Indeed, now the new season is upon us his ability to answer just about any question on this forum is missed more than ever. He had a unique and comprehensive database, and in my case always came up with an answer.

It would be great if the redoubtable Michael Rogers, owner of the fascinating footy stats website Rogers Results could come on here as he has in the past. Indeed anyone with an eye for interesting and amazing stats and coincidences would do well to peruse his site. I find it compelling reading, even if Geelong loses, and he generally has it updated for the completion of each round on the day after the last game is played.

Ron the Bear was amazing and sadly missed.

One could ask the most obscure question - for example the player who played the most games without playing against a particular opposing club or the player who played least games but met all opposing teams in his career - and he would have an answer so quick. I don't know how he did it.
 
Top 10 biggest comebacks over the last 10 years as far as margin at quarter time, half time and three quarter.

Can only find these but they are all-time and include games where teams used to kick 125 points each.
Looking at the tables in the link (both biggest comebacks and highest losing scores) I was a bit surprised by the high quarter scores by losing teams.

For example, in the famous 2001 comeback game, North Melbourne kicked 12.1.73 in the first quarter but still lost the match. There are other instances of teams kicking 10 goals in a quarter and still losing.

What is the record score for each quarter by teams that ultimately lost?
 

Log in to remove this ad.

Are free kicks way up this year? Or does it just seem to be that way given the coverage certain interpretations are getting?
The average number of free kicks per game is higher this year compared to the first six rounds of any of the past 10 seasons.

Average free kicks per game, by season
SeasonAverage (Season)Average (Rounds 1-6)
2012​
37.9​
38.4​
2013​
36.1​
41.9​
2014​
33.4​
32.9​
2015​
36.3​
38.1​
2016​
37.6​
40.2​
2017​
37.6​
38.0​
2018​
41.1​
42.5​
2019​
37.7​
38.8​
2020​
32.1​
34.0​
2021​
38.2​
41.1​
2022​
44.6​

Average free kicks per game, 2012 to Round 6 2022, by round
RoundAverage
Round 1
40.8​
Round 2
40.2​
Round 3
39.5​
Round 4
39.3​
Round 5
37.5​
Round 6
37.5​
Round 7
35.1​
Round 8
36.5​
Round 9
36.1​
Round 10
35.6​
Round 11
34.6​
Round 12
34.7​
Round 13
36.4​
Round 14
35.3​
Round 15
36.1​
Round 16
37.1​
Round 17
37.9​
Round 18
36.2​
Round 19
37.3​
Round 20
36.8​
Round 21
38.1​
Round 22
37.1​
Round 23
35.2​
Finals Week 1
36.7​
Semi Finals
37.5​
Preliminary Finals
37.6​
Grand Final
31.6​
 
Looking at the tables in the link (both biggest comebacks and highest losing scores) I was a bit surprised by the high quarter scores by losing teams.

For example, in the famous 2001 comeback game, North Melbourne kicked 12.1.73 in the first quarter but still lost the match. There are other instances of teams kicking 10 goals in a quarter and still losing.

What is the record score for each quarter by teams that ultimately lost?

Highest first quarter scores by losing teams
YearTeamQ1Q2Q3Q4TotalAgainstQ1Q2Q3Q4Total
2001​
North Melbourne
73​
24​
39​
23​
159​
Essendon
15​
61​
46​
49​
171​
1978​
Richmond
64​
1​
30​
22​
117​
Fitzroy
19​
47​
22​
46​
134​
1934​
North Melbourne
62​
14​
29​
11​
116​
Melbourne
15​
57​
13​
33​
118​
1960​
North Melbourne
61​
2​
8​
12​
83​
Essendon
14​
33​
18​
33​
98​
1940​
Melbourne
60​
29​
30​
32​
151​
Geelong
44​
50​
29​
31​
154​
2009​
Port Adelaide
60​
4​
25​
3​
92​
Brisbane
20​
27​
33​
27​
107​

Highest second quarter scores by losing teams
YearTeamQ1Q2Q3Q4TotalAgainstQ1Q2Q3Q4Total
1983​
Fitzroy
16​
78​
14​
30​
138​
St Kilda
48​
43​
37​
21​
149​
1973​
Western Bulldogs
16​
64​
14​
14​
108​
Hawthorn
39​
10​
41​
34​
124​
1976​
Essendon
12​
64​
12​
12​
100​
Fitzroy
29​
19​
24​
38​
110​
1991​
North Melbourne
26​
64​
18​
39​
147​
Fitzroy
47​
46​
23​
32​
148​
1991​
Sydney
57​
63​
14​
0​
134​
North Melbourne
37​
53​
42​
56​
188​

Highest third quarter scores by losing teams
YearTeamQ1Q2Q3Q4TotalAgainstQ1Q2Q3Q4Total
1984​
North Melbourne
29​
38​
70​
15​
152​
Fitzroy
50​
41​
33​
42​
166​
1993​
Melbourne
13​
19​
67​
14​
113​
Brisbane
24​
34​
24​
33​
115​
2000​
Brisbane
16​
16​
66​
14​
112​
Carlton
39​
59​
29​
29​
156​
1942​
Melbourne
27​
13​
64​
13​
117​
Richmond
26​
66​
24​
80​
196​
1964​
Fitzroy
21​
0​
63​
1​
85​
Western Bulldogs
0​
47​
6​
40​
93​
1989​
Fitzroy
22​
10​
63​
27​
122​
Carlton
34​
63​
26​
36​
159​

Highest fourth quarter scores by losing teams
YearTeamQ1Q2Q3Q4TotalAgainstQ1Q2Q3Q4Total
1992​
Essendon
2​
22​
7​
67​
98​
Fitzroy
30​
35​
60​
25​
150​
1980​
Fitzroy
23​
18​
39​
62​
142​
Carlton
35​
30​
66​
15​
146​
1989​
North Melbourne
19​
38​
15​
62​
134​
Richmond
45​
14​
59​
53​
171​
1978​
Geelong
20​
24​
23​
59​
126​
Melbourne
55​
32​
27​
25​
139​
1980​
Western Bulldogs
20​
23​
13​
57​
113​
Fitzroy
25​
23​
46​
31​
125​
1983​
Essendon
28​
7​
15​
57​
107​
North Melbourne
33​
37​
34​
24​
128​
 
Hey stats lovers

Can anyone tell me what David King meant on First Crack when he said "Freo are 12th with the footy"?

Is this just a clever way of talking about team average insde 50s per game? Or does someone know if this is an actual stat?

Thanks
 
Matthew Knights is filling in as West Coast Eagles coach this evening, this the first time he has coached at senior level since coaching Essendon against the Western Bulldogs in the final round of the 2010 AFL season. That match was played on 28 August 2010, making it close to 12 years or 4270 days ago.

Has there ever been such a long gap between senior games coached in the AFL/VFL either as a full time coach or as a caretaker coach before this?
That is a sensational question.
 
Matthew Knights is filling in as West Coast Eagles coach this evening, this the first time he has coached at senior level since coaching Essendon against the Western Bulldogs in the final round of the 2010 AFL season. That match was played on 28 August 2010, making it close to 12 years or 4270 days ago.

Has there ever been such a long gap between senior games coached in the AFL/VFL either as a full time coach or as a caretaker coach before this?
John Cahill in V/AFL: coached Collingwood in 1984 and not again until Port Adelaide in 1997. (He continually coached SANFL inbetween though).
 

(Log in to remove this ad.)

Matthew Knights is filling in as West Coast Eagles coach this evening, this the first time he has coached at senior level since coaching Essendon against the Western Bulldogs in the final round of the 2010 AFL season. That match was played on 28 August 2010, making it close to 12 years or 4270 days ago.

Has there ever been such a long gap between senior games coached in the AFL/VFL either as a full time coach or as a caretaker coach before this?
AFL Tables - Coaches

Jack Titus had a 24-year gap (1941-1965 at Richmond).
Tommy Lahiff a 21-year gap.
Dick Harris 20 years.
Bill Findlay 18 years.
Frank Hughes 17 years.
Charlie Cameron 16 years.
Roy Cazaly 15 years.
Herbie Matthews 15 years.
John Cahill 13 years.
Alec Hall 12 years.
Johnny Leonard 11 years.
Percy Parratt 11 years.
Bob Rose 10 years.
Charlie Sutton 10 years.
 
Last edited:
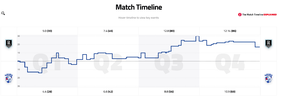
I'm sure you've all seen score timelines (aka the 'worm') on the AFL.com.au website (like the one below).
Screen Shot 2022-05-11 at 3.20.57 pm.png
Does anyone know (i) when these timelines started being used (ii) are the old ones still available and (iii) whether these timelines have been converted to some form of statistical table that can then be accessed? That combination of the team scores, margin and time for every point in a match then aggregated across all games could throw up some brilliant statistical information and help quantify concepts like 'the importance of momentum'. Love to find it if it exists!
 
I'm sure you've all seen score timelines (aka the 'worm') on the AFL.com.au website (like the one below).
View attachment 1397638
Does anyone know (i) when these timelines started being used (ii) are the old ones still available and (iii) whether these timelines have been converted to some form of statistical table that can then be accessed? That combination of the team scores, margin and time for every point in a match then aggregated across all games could throw up some brilliant statistical information and help quantify concepts like 'the importance of momentum'. Love to find it if it exists!
The URL for that game above is as follows - I have split it in 2 so that you can see it. delete the gap before matches

https://www.afl.com.au/afl/ matches/3873

You can change the 3873 to get other games, but at some point they start adding preseason games, AFLW games and now VFL games once it was expanded to include teams from the NEAFL.

You can't do it on your app. I tried to do it last year but found nothing.

The first game they have this for is Rd 1 2012 Melbourne v Brisbane, think there are only 6 of the 9 games of Rd 1, but the first 50 or 60 are a bit dodgy with games missing and double ups. Might be the same later on but i havent checked all 3873+ games.


https://www.afl.com.au/afl/ matches/1


The first game they have this for is Rd 1 2012 Melbourne v Brisbane, think there are only 6 of the 9 games of Rd 1, but the first 50 or 60 are a bit dodgy with games missing and double ups. Might be the same later on but i havent checked all 3873+ games.


They used to have worms from 2001-2011.
 
The URL for that game above is as follows - I have split it in 2 so that you can see it. delete the gap before matches

https://www.afl.com.au/afl/ matches/3873

You can change the 3873 to get other games, but at some point they start adding preseason games, AFLW games and now VFL games once it was expanded to include teams from the NEAFL.

You can't do it on your app. I tried to do it last year but found nothing.

The first game they have this for is Rd 1 2012 Melbourne v Brisbane, think there are only 6 of the 9 games of Rd 1, but the first 50 or 60 are a bit dodgy with games missing and double ups. Might be the same later on but i havent checked all 3873+ games.


https://www.afl.com.au/afl/ matches/1


Thanks RussellEbertHandball !
 
There are also scoreworms here. (2001-19 inclusive.)


Remove this Banner Ad

Stats questions

Remove this Banner Ad

Back
Top