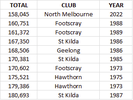
You asked for it*, so here is the list of how good each team's highest crowd against every other team is.
*You almost certainly did not ask for it
i.e.
- if you read down the column for Adelaide you can see that West Coast has the best highest crowd against them (number 1), followed by Richmond (no 2), then Collingwood etc.
- if you read across the rows you can see how each team ranks against every other team, including their average position at the end (the lower the number the better)
View attachment 1483729
You know it's a good table/graph when you have to include a lot of explanation
After a good look at the table, what caught my intrigue was North Melbourne being No.2 for Bulldogs, and Bulldogs being No.4 for North Melbourne. Thanks to AFL Tables I looked it up.
It was Rd 22 1998 with 68,050.
Going into that round, North Melbourne were top of the ladder and Bulldogs second, both with 15 wins and only 0.3 percent separating them. They were two games clear of Sydney in third spot. Bulldogs lead at every break but North Melbourne won 113-108


