Analysis Season 2023 - Statistics and Analytics Thread

Remove this Banner Ad

Status
Not open for further replies.
So considering Grasshopper17 has been doing so much homework I felt I better contribute again and update my stats differential across the season.
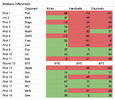
Screenshot 2023-07-26 at 2.47.38 pm.png
The green highlights a positive differential in that category and the red highlights a negative. This supports my "eye check" that we have been getting a lot more possession, and are no longer massively conceding the disposal count each week. I think this has a lot to do with our controlling of the ball and switching of the play style that IMO was nonexistent in the first half of the year. It looks like we have really swapped that around and now we have been still comfortably winning the kicks AND overall disposal count. A good trend towards the end of the season

What I also thought could be interesting would be to see how well we were also restricting teams in their disposal.
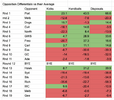
Screenshot 2023-07-26 at 2.47.51 pm.png

What this is showing is is the number of disposals that our opposition got in their game with us verses their average for the year. So for example Geelong had 203 kicks against, their average is 209.7, so their differential for this game was -6.7. Essentially in this case if you see a red square, that means they were down on their average for their game against us.

I think this shows a clear trend line since the essendon game where we are massively restricting teams in the number of disposals they usually have, while we continue to have more and more of the ball. Its an impressive form line we have started to hit, and its great to see we have continued it across both the Melbourne and Geelong games.

TLDR: We are winning overall disposals while also restricting opposition to below their normal averages in disposals.
 
I put this in another thread but will add it to this one also.

Not sure what to make of our last quarters.
We have won 8 last quarters for 8 wins. Those wins against Pies, North, Dockers, Bombers, Suns, Saints, Tigers & Eagles.

Of the 10 last quarters lost, we have won 5 games. Wins against Demons, Giants, Blues, Swans & Cats. All reasonable opponents.
The other 5 losses were against Power, Dogs, Crows, Hawks, Demons. All away games.

The only take away i see is losing the last quarter at home did not change the result as we are undefeated at The Gabba.
However, if we lose the last quarter playing away, to date we have lost those games.
Hopefully these are correct as i did them manually.


Game ResultMarginOpponentHome/AwayQ4 ResultMargin
Loss54PowerAwayLoss22
Win11DemonsHomeLoss27
Loss14DogsAwayLoss6
Win33PiesHomeWin3
Win75NorthAwayWin21
Win21GiantsAwayLoss1
Win48DockersHomeWin14
Win26BluesAwayLoss14
Win42BombersHomeWin25
Win43SunsHomeWin32
Loss17CrowsAwayLoss2
Loss25HawksAwayLoss15
Win16SwansHomeLoss3
Win28SaintsAwayWin1
Win81TigersHomeWin9
Win81EaglesHomeWin10
Loss1DemonsAwayLoss22
Win11CatsHomeLoss14
9 Home
9 Away
8 Wins
10 Losses
 
Some interesting analysis on ball movement style from this weeks David King/Champion Data info dump:


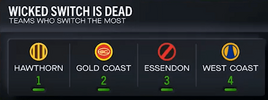
  • General point here is that Hawthorn switch by far the most in the comp, and it hasn't led to much in terms of scoring for any of these teams.
  • Somewhat surprisingly, we are in the bottom 5 for switching in the comp. I think to be fair short angled kicks don't count as switching the ball

1690357245377.png
1690357328409.png

  • Looking at teams who go long down the line, the point was made that you are likely to score from that specific play only 10% of the time. However, it sets you up to score from the next play by either forcing a stoppage, or gaining territory that lets you intercept from a more dangerous position.
  • From a switch you are likely to score 15% of the time but that may come with additional risk if you turn the ball over.
  • We aren't in the top 5 teams who go long down the line (due to us looking to move the ball through shorter 45 kicks).
1690357883887.png
  • However, when we do go long down the line we get a good return:
1690357692296.png


And finally the most interesting graphic - which teams are most likely to score next when a team goes down the line against them:

1690357804884.png

Us and Melbourne make complete sense given how our defences are set up. Port being so low is surprising given that they are one of the top 5 teams who go down the line, and collingwood are just middle of the pack.

Reinforces for me that against the Dees we have to avoid kicking long to contest as much as we can, but we might have some joy against the Pies and Port.
 

Log in to remove this ad.

Need to give you some kind of award Tom14 for regularly subjecting yourself to David King to provide this information for us.
 
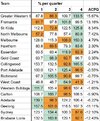
First 12 matches average scores compared to the last 6. A reasonable sample size

Scores Against

63 after Rich

80 with Rich


Scores For

100 after Rich

96 with Rich

I think the backline looks much better now.
It's interesting how when you defend better, you also attack better. I think a lot of that is about mindset though also... It's important to differentiate between defending to stop the other team from scoring (ala Ross Lyon), vs defending to win the ball back and be able to score yourself. I imagine it's easy to tip too far in either direction... We would want to remain conscious of having a balance.
 
Last edited:
Some fascinating stuff from Leigh Montagna on AFL 360 tonight. It ties in with something I touched on after our Adelaide game. That day we kept knocking the ball back inside 50 pretty relentlessly, but for little result, apart from a lot of behinds. Melbourne, it seems, were having the same issues for a 6 week period:

20230726_205859.jpg

Then in the last 3 weeks (including against us), they have changed things up:

20230726_205931.jpg

A good analogy here is a soccer corner. When a team is taking a corner, they usually have 7 or 8 players come up into the penalty area, and obviously 8 or 9 defenders. You usually need the corner kick to be absolutely pinpoint and their opponent to be asleep at the wheel to get a clean goal. Otherwise it all gets a bit messy and occasionally you get a random scrambled goal as a result of the ball pinballing off about 5 or 6 bodies in quick succession.

What happens the vast majority of the time though is, well, nothing. The corner kick isn't spot on, the attacking team goes for a header that goes the wrong direction, or maybe the defence is able to hack it out of there. Usually, the back markers for the attacking team regain possession, about 30m out from goal.

But it's interesting to see what they do then. They very rarely if ever, just bang it back into the penalty area. Their first pass is generally lateral. This buys the attacking team time to reset their positioning, but it also draws the defending team out of the penalty area, ideally creating space for the next attack.

I believe this is what Melbourne have attempted, if indeed it's been a deliberate ploy... And we have to remember Joey is only going off 3 weeks of data here. But they may be deliberately setting their zone defence deeper, away from their attacking goal, with the intent of cutting them off in midfield rather than around the 50m arc. Giving the other team enough rope to hang themselves, so to speak.

So this is a watch for me... They've kicked scores of 97, 105 and 79, so an average of 94. It's above average without being spectacular.

The other side of the coin however is that they've conceded 93, 104 and 58, for an average of 85. That is also above the league average (slightly), so it's interesting to see that their traditionally stingy defence has been far more porous during this time.

So I'll be interested to see if they are able to sustain this attacking method, while also tightening up their defence. Because by starting their attacking chains further from goal, yes they are scoring better, but this also implies they are allowing their opposition to start (and finish) THEIR attacking chains CLOSER to goal, and this may be affecting their defence.

But if they can make it work, we should really go to town on this, because we often have similar issues with getting a lot of shots, but not always great shots - long range, on the boundary, or under pressure.

Risk and reward.
 
Some fascinating stuff from Leigh Montagna on AFL 360 tonight. It ties in with something I touched on after our Adelaide game. That day we kept knocking the ball back inside 50 pretty relentlessly, but for little result, apart from a lot of behinds. Melbourne, it seems, were having the same issues for a 6 week period:

View attachment 1756667

Then in the last 3 weeks (including against us), they have changed things up:

View attachment 1756668

A good analogy here is a soccer corner. When a team is taking a corner, they usually have 7 or 8 players come up into the penalty area, and obviously 8 or 9 defenders. You usually need the corner kick to be absolutely pinpoint and their opponent to be asleep at the wheel to get a clean goal. Otherwise it all gets a bit messy and occasionally you get a random scrambled goal as a result of the ball pinballing off about 5 or 6 bodies in quick succession.

What happens the vast majority of the time though is, well, nothing. The corner kick isn't spot on, the attacking team goes for a header that goes the wrong direction, or maybe the defence is able to hack it out of there. Usually, the back markers for the attacking team regain possession, about 30m out from goal.

But it's interesting to see what they do then. They very rarely if ever, just bang it back into the penalty area. Their first pass is generally lateral. This buys the attacking team time to reset their positioning, but it also draws the defending team out of the penalty area, ideally creating space for the next attack.

I believe this is what Melbourne have attempted, if indeed it's been a deliberate ploy... And we have to remember Joey is only going off 3 weeks of data here. But they may be deliberately setting their zone defence deeper, away from their attacking goal, with the intent of cutting them off in midfield rather than around the 50m arc. Giving the other team enough rope to hang themselves, so to speak.

So this is a watch for me... They've kicked scores of 97, 105 and 79, so an average of 94. It's above average without being spectacular.

The other side of the coin however is that they've conceded 93, 104 and 58, for an average of 85. That is also above the league average (slightly), so it's interesting to see that their traditionally stingy defence has been far more porous during this time.

So I'll be interested to see if they are able to sustain this attacking method, while also tightening up their defence. Because by starting their attacking chains further from goal, yes they are scoring better, but this also implies they are allowing their opposition to start (and finish) THEIR attacking chains CLOSER to goal, and this may be affecting their defence.

But if they can make it work, we should really go to town on this, because we often have similar issues with getting a lot of shots, but not always great shots - long range, on the boundary, or under pressure.

Risk and reward.

Nothing new

What does every team want to do to stop an opponent scoring? Flood

Easier to do that if all the numbers are already there
 
Some fascinating stuff from Leigh Montagna on AFL 360 tonight. It ties in with something I touched on after our Adelaide game. That day we kept knocking the ball back inside 50 pretty relentlessly, but for little result, apart from a lot of behinds. Melbourne, it seems, were having the same issues for a 6 week period:

View attachment 1756667

Then in the last 3 weeks (including against us), they have changed things up:

View attachment 1756668

A good analogy here is a soccer corner. When a team is taking a corner, they usually have 7 or 8 players come up into the penalty area, and obviously 8 or 9 defenders. You usually need the corner kick to be absolutely pinpoint and their opponent to be asleep at the wheel to get a clean goal. Otherwise it all gets a bit messy and occasionally you get a random scrambled goal as a result of the ball pinballing off about 5 or 6 bodies in quick succession.

What happens the vast majority of the time though is, well, nothing. The corner kick isn't spot on, the attacking team goes for a header that goes the wrong direction, or maybe the defence is able to hack it out of there. Usually, the back markers for the attacking team regain possession, about 30m out from goal.

But it's interesting to see what they do then. They very rarely if ever, just bang it back into the penalty area. Their first pass is generally lateral. This buys the attacking team time to reset their positioning, but it also draws the defending team out of the penalty area, ideally creating space for the next attack.

I believe this is what Melbourne have attempted, if indeed it's been a deliberate ploy... And we have to remember Joey is only going off 3 weeks of data here. But they may be deliberately setting their zone defence deeper, away from their attacking goal, with the intent of cutting them off in midfield rather than around the 50m arc. Giving the other team enough rope to hang themselves, so to speak.

So this is a watch for me... They've kicked scores of 97, 105 and 79, so an average of 94. It's above average without being spectacular.

The other side of the coin however is that they've conceded 93, 104 and 58, for an average of 85. That is also above the league average (slightly), so it's interesting to see that their traditionally stingy defence has been far more porous during this time.

So I'll be interested to see if they are able to sustain this attacking method, while also tightening up their defence. Because by starting their attacking chains further from goal, yes they are scoring better, but this also implies they are allowing their opposition to start (and finish) THEIR attacking chains CLOSER to goal, and this may be affecting their defence.

But if they can make it work, we should really go to town on this, because we often have similar issues with getting a lot of shots, but not always great shots - long range, on the boundary, or under pressure.

Risk and reward.
Great spot. I think we should be ok here. I don't have the exact numbers, but it seems since the bye, we have been less reliant on trapping the opposition in their D50, and keep dumping the ball back into a nest of defenders. We seem to be effecting more between the arcs intercepts, and therefore have more space to move the ball once we effect a turnover. This means 1) there are less defenders ahead of the ball, and 2) more angles in which to move the ball across the widest part of the oval - both means more space to work in, and therefore the ChampionData statistic that we are currently the #1 team in scoring from turnovers - and this has been the key to winning deep in September, ever since at least Richmond in 2017.

Even in 2019 the first year we were good, we were #1 in scores from forward half chains. It's just that our chains start from a bit deeper in our own end, therefore we can be more creative in how we score. It has also reduced our reliance of scoring from forward 50 stoppages, which can be more hit and miss depending on the day, and the opposition.
 

(Log in to remove this ad.)

I
Great spot. I think we should be ok here. I don't have the exact numbers, but it seems since the bye, we have been less reliant on trapping the opposition in their D50, and keep dumping the ball back into a nest of defenders. We seem to be effecting more between the arcs intercepts, and therefore have more space to move the ball once we effect a turnover. This means 1) there are less defenders ahead of the ball, and 2) more angles in which to move the ball across the widest part of the oval - both means more space to work in, and therefore the ChampionData statistic that we are currently the #1 team in scoring from turnovers - and this has been the key to winning deep in September, ever since at least Richmond in 2017.

Even in 2019 the first year we were good, we were #1 in scores from forward half chains. It's just that our chains start from a bit deeper in our own end, therefore we can be more creative in how we score. It has also reduced our reliance of scoring from forward 50 stoppages, which can be more hit and miss depending on the day, and the opposition.
I feel as though we improved in this area a lot initially. Even Melbourne we mostly attacked in a much more clever way. Just didn't turn up at the start - lost the plot at the end.

However i think we have regressed in the past 2 weeks.

I check the inside 50 count regularly within games. Against Geelong we were absolutely smashing them for most of the game but not converting it. I felt we were bombing it a little bit but also stuffing up chances so it wasn't too bad.

Against the GC we were as bad as we have been since the great re-set. We were well on top early for inside 50s but doing nothing with it. So many blind long kicks. Not honouring leads or not getting them. That's what worried me about the loss. It showed a regression tactically initially, and then from half way through second quarter a regression in application.

Gee you would want a response this week.
 
I

I feel as though we improved in this area a lot initially. Even Melbourne we mostly attacked in a much more clever way. Just didn't turn up at the start - lost the plot at the end.

However i think we have regressed in the past 2 weeks.

I check the inside 50 count regularly within games. Against Geelong we were absolutely smashing them for most of the game but not converting it. I felt we were bombing it a little bit but also stuffing up chances so it wasn't too bad.

Against the GC we were as bad as we have been since the great re-set. We were well on top early for inside 50s but doing nothing with it. So many blind long kicks. Not honouring leads or not getting them. That's what worried me about the loss. It showed a regression tactically initially, and then from half way through second quarter a regression in application.

Gee you would want a response this week.

Our points from turnover have cratered the last two weeks. Not surprising given Geelong are a well organised defence and we got beaten up by gold coast in every part of the game, but will be a big concern if it continues.
 
Our points from turnover have cratered the last two weeks. Not surprising given Geelong are a well organised defence and we got beaten up by gold coast in every part of the game, but will be a big concern if it continues.
Yeah as mentioned i think the concerning thing v Gold Coast is we were not getting beaten up in every facet early on, but our turnover game was off and our entries regressed to bombing it long / kicking blindly
 
I think midfield depth. Oscar, Neale and Dunkley run out of puff doing 90% of the midfield work
I think this is becoming more and more evident. We are massively reliant on a few players but do little to give them backup. That and our next best option was a first year player now out for the year
 
Not a happy update today - have seen quite a few bits of data released about our game this week based on a 3 or 4 week sample, none of which are good.

From Shannon Gill (Code Sports):

The Lions are finding it harder to move the ball, their intercept and transition game slipping from one of the best in the league to average or worse, while also being easier to move the ball against.

Some 36.7 per cent of their scoring was generated from defensive-half intercepts up to round 17 (first in the AFL), that has dropped to 19 per cent and 14th in the league. This all adds up to less of the game being played in the Lions’ forward half, which has been a pillar of their game. Up until round 17, their forward-half time differential was almost nine minutes – top of the league. Now they’re tenth and barely in the positive for it.

1691623949744.png

Some caveats worth noting -

  • Its a really obvious point but a sample size of 4 weeks where we've gone 2-2 is going to have worse data than the rest of the season.
  • It is also a 4 week sample that includes 3 away games and 1 home game against the Cats who we've always struggled against.
  • What isn't covered here is that this 4 week period includes 3 of our worst midfield performances (dees, suns, freo) of the season. What is concerning is that we have to fix this issue quickly before finals.
Also was a fair bit of commentary on this week's david king data dump on similar issues, and on Lachie Neale's form. Based on Champion data's secret herbs and spices relative rating formula, he's now barely within the top 300 players in the competition over the last 3 weeks.
 

Five-plus goal streaks conceded in 2023​

23 - West Coast
16 - Hawthorn, North Melbourne
13 - Gold Coast
11 - Western Bulldogs
9 - Essendon
8 - Fremantle
7 - Adelaide, Richmond, St Kilda
6 - Greater Western Sydney
5 - Carlton, Collingwood, Port Adelaide, Sydney
4 - Brisbane, Geelong, Melbourne
 

Five-plus goal streaks conceded in 2023​

23 - West Coast
16 - Hawthorn, North Melbourne
13 - Gold Coast
11 - Western Bulldogs
9 - Essendon
8 - Fremantle
7 - Adelaide, Richmond, St Kilda
6 - Greater Western Sydney
5 - Carlton, Collingwood, Port Adelaide, Sydney
4 - Brisbane, Geelong, Melbourne
Thats one list you are better off being at the bottom of.
 

Five-plus goal streaks conceded in 2023​

23 - West Coast
16 - Hawthorn, North Melbourne
13 - Gold Coast
11 - Western Bulldogs
9 - Essendon
8 - Fremantle
7 - Adelaide, Richmond, St Kilda
6 - Greater Western Sydney
5 - Carlton, Collingwood, Port Adelaide, Sydney
4 - Brisbane, Geelong, Melbourne

Interesting Geelong would be so low.
 
Wanted to touch on something that's been bugging me for a couple of weeks. I think Daniel Hoyne from Champion Data started peddling this a couple of weeks ago and it's just plain wrong. I don't think he had it wrong per se, but what he said has been blown up and taken out of all proportion.

He started out with something along the lines of "the last 6 weeks, Brisbane games have had an average of 80 stoppages. This is incredibly high when the league average is only 60 or thereabouts".

Nothing factually incorrect about this... I don't know exactly how many stoppages the average game has but I'm happy to go with his 60-odd.

But this got blown out of proportion and got interpreted as "teams have figured out that Brisbane are good at the turnover game, so now, in the last 6 weeks they are trying to play a high stoppage game instead, to take that off them. And that is why their turnover game has dropped away."

So I'm like, "hmmmm, this in interesting... I watch the Lions quite closely and I haven't really noticed any real shift in terms of our games becoming more congested and clogged up etc".

So I've gone and looked at the numbers for the whole season, and guess what?

OUR SEASON-LONG AVERAGE STOPPAGES PER GAME IS... 78.

And in the last 6 weeks, our average stoppages per game has been... 78.

In fact, you can slice this any way you like. If we go back to our win over Sydney, that night we won clearances 48-39. That's 87 stoppages, an unusually high number even for our games.

After that game, we were averaging 80.7 stoppages per game. Since that game, we've averaged just 74.4. So our average stoppages per game have actually FALLEN by 6.3 since round 14.

The most number of stoppages we have had in a game was against Adelaide in Round 11, when we won clearances 57-51. But if I recall correctly, so many of those were inside our 50 and we got so little out of them, that those wins were basically irrelevant.

Anyway, I think the moral of this story is that there's no real pattern to our stoppage data here, except to say that we tend to have more than most teams, and this has been a trend for the whole season, not just recently.

So by extension of this, it can be argued that our struggles to score from turnover recently can be put down to other things (like perhaps our midfield struggling in general), rather than teams deliberately setting out to have high stoppage games against us.

Having said that, I sorted all our games in order of how many stoppages each of them had, and compared them to our winning/losing margins, with interesting results. For our 11 games with the least stoppages, we are 8-3 with +347 for/against. Then for our 11 games with the most stoppages, we are still 8-3 but with only +50 for/against.

So it's only a loose correlation, but there does seem to be a pattern between us playing our best football in lower stoppage games. But if it is indeed a trend, it's been season-long, not just the last few weeks.


Match
Stoppages​
Margin​
v Eagles
64​
81​
v Essendon
65​
42​
v Richmond
68​
81​
@ St Kilda
70​
28​
@ North
71​
75​
v Geelong
71​
11​
@ Bulldogs
72​
-14​
v Freo
74​
48​
@ Hawthorn
74​
-25​
@ Giants
75​
21​
@ Melbourne
77​
-1​
v Suns
78​
43​
@ Collingwood
78​
24​
@ Suns
78​
-41​
v Adelaide
82​
6​
@ Freo
82​
3​
v Collingwood
83​
33​
@ Carlton
85​
26​
@ Port
85​
-54​
v Sydney
87​
16​
v Melbourne
92​
11​
@ Adelaide
108​
-17​
 
Last edited:
Wanted to touch on something that's been bugging me for a couple of weeks. I think Daniel Hoyne from Champion Data started peddling this a couple of weeks ago and it's just plain wrong. I don't think he had it wrong per se, but what he said has been blown up and taken out of all proportion.

He started out with something along the lines of "the last 6 weeks, Brisbane games have had an average of 80 stoppages. This is incredibly high when the league average is only 60 or thereabouts".

Nothing factually incorrect about this... I don't know exactly how many stoppages the average game has but I'm happy to go with his 60-odd.

But this got blown out of proportion and got interpreted as "teams have figured out that Brisbane are good at the turnover game, so now, in the last 6 weeks they are trying to play a high stoppage game instead, to take that off them. And that is why their turnover game has dropped away."

So I'm like, "hmmmm, this in interesting... I watch the Lions quite closely and I haven't really noticed any real shift in terms of our games becoming more congested and clogged up etc".

So I've gone and looked at the numbers for the whole season, and guess what?

OUR SEASON-LONG AVERAGE STOPPAGES PER GAME IS... 78.

And in the last 6 weeks, our average stoppages per game has been... 78.

In fact, you can slice this any way you like. If we go back to our win over Sydney, that night we won clearances 48-39. That's 87 stoppages, an unusually high number even for our games.

After that game, we were averaging 80.7 stoppages per game. Since that game, we've averaged just 74.4. So our average stoppages per game have actually FALLEN by 6.3 since round 14.

The most number of stoppages we have had in a game was against Adelaide in Round 11, when we won clearances 57-51. But if I recall correctly, so many of those were inside our 50 and we got so little out of them, that those wins were basically irrelevant.

Anyway, I think the moral of this story is that there's no real pattern to our stoppage data here, except to say that we tend to have more than most teams, and this has been a trend for the whole season, not just recently.

So by extension of this, it can be argued that our struggles to score from turnover recently can be put down to other things (like perhaps our midfield struggling in general), rather than teams deliberately setting out to have high stoppage games against us.

Having said that, I sorted all our games in order of how many stoppages each of them had, and compared them to our winning/losing margins, with interesting results. For our 11 games with the least stoppages, we are 8-3 with +347 for/against. Then for our 11 games with the most stoppages, we are still 8-3 but with only +50 for/against.

So it's only a loose correlation, but there does seem to be a pattern between us playing our best football in lower stoppage games. But if it is indeed a trend, it's been season-long, not just the last few weeks.


Match
Stoppages​
Margin​
v Eagles
64​
81​
v Essendon
65​
42​
v Richmond
68​
81​
@ St Kilda
70​
28​
@ North
71​
75​
v Geelong
71​
11​
@ Bulldogs
72​
-14​
v Freo
74​
48​
@ Hawthorn
74​
-25​
@ Giants
75​
21​
@ Melbourne
77​
-1​
v Suns
78​
43​
@ Collingwood
78​
24​
@ Suns
78​
-41​
v Adelaide
82​
6​
@ Freo
82​
3​
v Collingwood
83​
33​
@ Carlton
85​
26​
@ Port
85​
-54​
v Sydney
87​
16​
v Melbourne
92​
11​
@ Adelaide
108​
-17​

Grasshopper data > champion data.
 
Wanted to touch on something that's been bugging me for a couple of weeks. I think Daniel Hoyne from Champion Data started peddling this a couple of weeks ago and it's just plain wrong. I don't think he had it wrong per se, but what he said has been blown up and taken out of all proportion.

He started out with something along the lines of "the last 6 weeks, Brisbane games have had an average of 80 stoppages. This is incredibly high when the league average is only 60 or thereabouts".

Nothing factually incorrect about this... I don't know exactly how many stoppages the average game has but I'm happy to go with his 60-odd.

But this got blown out of proportion and got interpreted as "teams have figured out that Brisbane are good at the turnover game, so now, in the last 6 weeks they are trying to play a high stoppage game instead, to take that off them. And that is why their turnover game has dropped away."

So I'm like, "hmmmm, this in interesting... I watch the Lions quite closely and I haven't really noticed any real shift in terms of our games becoming more congested and clogged up etc".

So I've gone and looked at the numbers for the whole season, and guess what?

OUR SEASON-LONG AVERAGE STOPPAGES PER GAME IS... 78.

And in the last 6 weeks, our average stoppages per game has been... 78.

In fact, you can slice this any way you like. If we go back to our win over Sydney, that night we won clearances 48-39. That's 87 stoppages, an unusually high number even for our games.

After that game, we were averaging 80.7 stoppages per game. Since that game, we've averaged just 74.4. So our average stoppages per game have actually FALLEN by 6.3 since round 14.

The most number of stoppages we have had in a game was against Adelaide in Round 11, when we won clearances 57-51. But if I recall correctly, so many of those were inside our 50 and we got so little out of them, that those wins were basically irrelevant.

Anyway, I think the moral of this story is that there's no real pattern to our stoppage data here, except to say that we tend to have more than most teams, and this has been a trend for the whole season, not just recently.

So by extension of this, it can be argued that our struggles to score from turnover recently can be put down to other things (like perhaps our midfield struggling in general), rather than teams deliberately setting out to have high stoppage games against us.

Having said that, I sorted all our games in order of how many stoppages each of them had, and compared them to our winning/losing margins, with interesting results. For our 11 games with the least stoppages, we are 8-3 with +347 for/against. Then for our 11 games with the most stoppages, we are still 8-3 but with only +50 for/against.

So it's only a loose correlation, but there does seem to be a pattern between us playing our best football in lower stoppage games. But if it is indeed a trend, it's been season-long, not just the last few weeks.


Match
Stoppages​
Margin​
v Eagles
64​
81​
v Essendon
65​
42​
v Richmond
68​
81​
@ St Kilda
70​
28​
@ North
71​
75​
v Geelong
71​
11​
@ Bulldogs
72​
-14​
v Freo
74​
48​
@ Hawthorn
74​
-25​
@ Giants
75​
21​
@ Melbourne
77​
-1​
v Suns
78​
43​
@ Collingwood
78​
24​
@ Suns
78​
-41​
v Adelaide
82​
6​
@ Freo
82​
3​
v Collingwood
83​
33​
@ Carlton
85​
26​
@ Port
85​
-54​
v Sydney
87​
16​
v Melbourne
92​
11​
@ Adelaide
108​
-17​

I'd need to go back and re-listen to things, but also noticed this and was quite confused. My thinking was that Hoyne has specifically been referring to stoppages excluding centre bounce stoppages - which when I did a quick check just looking at stoppage clearances as a proxy number did seem to line up with an increase in that 4 week period.

On the other hand its very funny if Champion Data is just purely wrong so no complaints here.
 
Wanted to touch on something that's been bugging me for a couple of weeks. I think Daniel Hoyne from Champion Data started peddling this a couple of weeks ago and it's just plain wrong. I don't think he had it wrong per se, but what he said has been blown up and taken out of all proportion.

He started out with something along the lines of "the last 6 weeks, Brisbane games have had an average of 80 stoppages. This is incredibly high when the league average is only 60 or thereabouts".

Nothing factually incorrect about this... I don't know exactly how many stoppages the average game has but I'm happy to go with his 60-odd.

But this got blown out of proportion and got interpreted as "teams have figured out that Brisbane are good at the turnover game, so now, in the last 6 weeks they are trying to play a high stoppage game instead, to take that off them. And that is why their turnover game has dropped away."

So I'm like, "hmmmm, this in interesting... I watch the Lions quite closely and I haven't really noticed any real shift in terms of our games becoming more congested and clogged up etc".

So I've gone and looked at the numbers for the whole season, and guess what?

OUR SEASON-LONG AVERAGE STOPPAGES PER GAME IS... 78.

And in the last 6 weeks, our average stoppages per game has been... 78.

In fact, you can slice this any way you like. If we go back to our win over Sydney, that night we won clearances 48-39. That's 87 stoppages, an unusually high number even for our games.

After that game, we were averaging 80.7 stoppages per game. Since that game, we've averaged just 74.4. So our average stoppages per game have actually FALLEN by 6.3 since round 14.

The most number of stoppages we have had in a game was against Adelaide in Round 11, when we won clearances 57-51. But if I recall correctly, so many of those were inside our 50 and we got so little out of them, that those wins were basically irrelevant.

Anyway, I think the moral of this story is that there's no real pattern to our stoppage data here, except to say that we tend to have more than most teams, and this has been a trend for the whole season, not just recently.

So by extension of this, it can be argued that our struggles to score from turnover recently can be put down to other things (like perhaps our midfield struggling in general), rather than teams deliberately setting out to have high stoppage games against us.

Having said that, I sorted all our games in order of how many stoppages each of them had, and compared them to our winning/losing margins, with interesting results. For our 11 games with the least stoppages, we are 8-3 with +347 for/against. Then for our 11 games with the most stoppages, we are still 8-3 but with only +50 for/against.

So it's only a loose correlation, but there does seem to be a pattern between us playing our best football in lower stoppage games. But if it is indeed a trend, it's been season-long, not just the last few weeks.


Match
Stoppages​
Margin​
v Eagles
64​
81​
v Essendon
65​
42​
v Richmond
68​
81​
@ St Kilda
70​
28​
@ North
71​
75​
v Geelong
71​
11​
@ Bulldogs
72​
-14​
v Freo
74​
48​
@ Hawthorn
74​
-25​
@ Giants
75​
21​
@ Melbourne
77​
-1​
v Suns
78​
43​
@ Collingwood
78​
24​
@ Suns
78​
-41​
v Adelaide
82​
6​
@ Freo
82​
3​
v Collingwood
83​
33​
@ Carlton
85​
26​
@ Port
85​
-54​
v Sydney
87​
16​
v Melbourne
92​
11​
@ Adelaide
108​
-17​

Would have just been sorting by last 6 weeks against comp average and didn’t bother checking historical avg.

This is why I hate champion data. So much bs presented.
 
Status
Not open for further replies.

Remove this Banner Ad

Remove this Banner Ad

Back
Top