Analysis Season 2024 - Statistics and Analytics Thread

Remove this Banner Ad

I wouldn't take Starce as a guaranteed in. It was a pretty bad hit and if they miss any milestones they tend to take another week.

If we want to stiffen the defence, it really should be McKenna out and Brain staying. I love Answerth as a lock-down but he has had a few weeks off and tends to come in a bit rusty especially with his kicking. Brain is fit and in relatively good form.
If Starce isn't right then Answerth comes in for McKenna. He's giving us so little in attack right now that we might as well go for the bloke who's actually prepared to defend and put his body on the line.
 
If Starce isn't right then Answerth comes in for McKenna. He's giving us so little in attack right now that we might as well go for the bloke who's actually prepared to defend and put his body on the line.
i'd be happy with that. Answerth's kicking has improved BUT i wouldn't be too certain about him with the pill after a lay-off.

Brain's good disposal helps the overall mix i think. very sure with it. only had 10 poss but went at 100%
 

Log in to remove this ad.

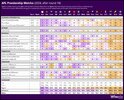
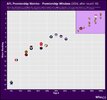
As always, you can use stats to tell you whatever you like pretty much. According to Champion Data's premiership metrics, as of yesterday we are now officially in the premiership window:

20240715_182353.jpg 20240715_182358.jpg

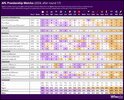
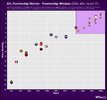
This has come about because we have moved from #7 on turnovers differential to #6. Here is last week's chart:

20240708_193741.jpg
20240715_192841.jpg

So ostensibly we have gone from borderline window to in the window.

But have a look at that very bottom line: it's changed from 4.9 to 5.1 at the same time. That's because while our turnover differential has gone from #7 to #6, we've

  • Moved from #1 to #2 for shots at goal conceded
  • Moved from #4 to #6 for total points conceded
  • Moved from #1 to #2 for marks on the lead conceded
  • Moved from #14 to #15 for shots per inside 50 conceded
  • Moved from #10 to #11 for opposition bounces (if you're thinking this is a weird stat to be a "premiership metric", I agree. Perhaps it's a measure of midfield defensive pressure/intent)
We've also gone from #4 to #3 for points from turnover differential, and from #3 to #2 for shots at goal differential.

So I guess the moral to the story is believe what you want. Just make sure you're well informed.
 
Nathan Buckley sensational on The Couch tonight about the irrelevance of hit out stats, just get rid of that meaningless stat please.
This is going to render my dissertation on McInerney v Grundy in the preview thread irrelevant isn't it 🙁
 
As always, you can use stats to tell you whatever you like pretty much. According to Champion Data's premiership metrics, as of yesterday we are now officially in the premiership window:

View attachment 2049381View attachment 2049382

This has come about because we have moved from #7 on turnovers differential to #6. Here is last week's chart:

View attachment 2049384
View attachment 2049385

So ostensibly we have gone from borderline window to in the window.

But have a look at that very bottom line: it's changed from 4.9 to 5.1 at the same time. That's because while our turnover differential has gone from #7 to #6, we've

  • Moved from #1 to #2 for shots at goal conceded
  • Moved from #4 to #6 for total points conceded
  • Moved from #1 to #2 for marks on the lead conceded
  • Moved from #14 to #15 for shots per inside 50 conceded
  • Moved from #10 to #11 for opposition bounces (if you're thinking this is a weird stat to be a "premiership metric", I agree. Perhaps it's a measure of midfield defensive pressure/intent)
We've also gone from #4 to #3 for points from turnover differential, and from #3 to #2 for shots at goal differential.

So I guess the moral to the story is believe what you want. Just make sure you're well informed.

The bounces are a weird stat but it’s funny it makes it in there as one of the key stats a premier is always top six.

Best I can think of is that top teams can pick apart an opposition and find space to have a bounce, but it’s definitely the effect of a good team not the cause.
 
Best I can think of is that top teams can pick apart an opposition and find space to have a bounce, but it’s definitely the effect of a good team not the cause.
This is going to seem a bit petty but it's an important distinction to make.

This stat is not about the top teams being able to pick apart an opposition and find space to have a bounce. It is simply about how well top sides deny their opposition the time and space to have a bounce. The stat in question is all about opposition bounces, not your own bounces, or even the differential between their bounces and your bounces.

So in theory, we can be #18 for the number of bounces we have (and we are, funnily enough), but that need not influence how good we are at restricting our opposition from bouncing the ball.

Reckon we've been #18 for our own bounces for around 5 years or so. Just a function of our game style.

Last year our pressure acts # was reasonably low compared to the comp, but that was a function of game style as well - we were pretty high up on the pressure acts differential.
 
Reckon we've been #18 for our own bounces for around 5 years or so. Just a function of our game style.

Last year our pressure acts # was reasonably low compared to the comp, but that was a function of game style as well - we were pretty high up on the pressure acts differential.

Longer than that I reckon. Maybe Hanley our last regular bouncer
 
Reckon we've been #18 for our own bounces for around 5 years or so. Just a function of our game style.

Last year our pressure acts # was reasonably low compared to the comp, but that was a function of game style as well - we were pretty high up on the pressure acts differential.
We seem to set up very wide over the entire field, which doesn't leave much space for running and bouncing but does open up more gaps in the middle that we're taking more advantage of this year (Zorko and McKenna) or space on the wing if we get a quick enough switch. A lot of other teams congest even more down the line for example, which often opens up the far wing if someone can get a run on - or defensive teams flood back.
 
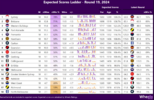
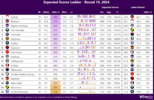
Latest update on the expected score ladder (thanks to Andrew Whelan of Wheelo ratings which is by far the best AFL stats site these days):

1721791592371.png

We are #2 for points for and #2 for points against on expected score.

Because I'm bored I went through and calculated the difference between a team's actual score against and their expected score against - postive scores indicate that they have conceded more than expected, negative vice versa:


TeamScore against minus expected score against
Sydney0
Carlton23
Brisbane96
Freo-23
GWS-61
Cats-23
Port106
Essendon69
Dogs21
Dees-32
Hawks65
Suns126
Pies113
Crows-25
Saints-51
Eagles87
Norf66
Tigers39

As you can see we have been the 4th least lucky* in terms of our opponent's conversion - Only the Suns, Pies and Port have a bigger gap. Conversly the Giants have been the luckiest so far.

On a per round basis the gap is not massive for us - we are conceding on average about a goal more than our expected score against says that we should. But its enough to drop our points against average from 78.6 to 73.2 points per game.

All in all - its not making a huge difference across the year, but we have had some concentrated accurate kicking against us that have flipped a couple of results, and made a couple of others closer than they could have been (last 2 weeks a good example of that).

*** note - I say 'lucky' above because by and large an opponent's expected conversion is not something that you can influence. But it is not clear to what extent expected score models can factor in pressure on kicks (my guess is that they really can't) so that factor can't be discounted.

Expected set shot accuracy against vs set shot accuracy against
is just pure luck though. I don't have numbers broken down comp wide for this year on it, but from memory last year the saints were an example of a team whose defensive record got way overblown because their opponents were spraying set shots. Callum Wilkie really should be thanking that for his AA blazer.
 

Attachments

  • 1721791819213.png
    1721791819213.png
    1.1 MB · Views: 40
Last edited:

(Log in to remove this ad.)

*** note - I say 'lucky' above because by and large an opponent's expected conversion is not something that you can influence. But it is not clear to what extent expected score models can factor in pressure on kicks (my guess is that they really can't) so that factor can't be discounted.
I asked the great man about this last year. He reckons they are... How exactly I guess is another story 👇

 
I asked the great man about this last year. He reckons they are... How exactly I guess is another story 👇


Yeah I do recall hearing Hoyney say that.

But how exactly do they quantify pressure has always been my question as well - I know they have a formula that they use for the secret herbs and spices of the pressure rating (a tackle is worth an amount, a smother another, being within 2m and affecting the disposal is as well I think), but I've always thought that stat was pretty iffy. Useful for comparison purposes but with all stats, take with a severe grain of salt.
 

SHOTS AT GOAL FROM HIGH TACKLE FREE KICKS
Hawthorn – 20
Collingwood – 10
Gold Coast – 10
Western Bulldogs – 9
North Melbourne – 9
Adelaide – 9
Port Adelaide – 8
West Coast – 8
GWS – 7
Carlton – 6
Fremantle – 5
Essendon – 5
St Kilda – 4
Brisbane – 4
Sydney – 4
Richmond – 4
Melbourne – 4
Geelong – 1
 

SHOTS AT GOAL FROM HIGH TACKLE FREE KICKS
Hawthorn – 20
Collingwood – 10
Gold Coast – 10
Western Bulldogs – 9
North Melbourne – 9
Adelaide – 9
Port Adelaide – 8
West Coast – 8
GWS – 7
Carlton – 6
Fremantle – 5
Essendon – 5
St Kilda – 4
Brisbane – 4
Sydney – 4
Richmond – 4
Melbourne – 4
Geelong – 1
Honouring this by calling it a "tactic" is really ****ing moronic given the concussion saga going on right now.
 
Honouring this by calling it a "tactic" is really ****ing moronic given the concussion saga going on right now.

Big time. Yet another example of the hypocritical, inconsistent AFL.
 
Honouring this by calling it a "tactic" is really ****ing moronic given the concussion saga going on right now.
Hopefully these articles bring enough attention to it that the umpires make it a focus and start not paying the free kicks.
 
Big time. Yet another example of the hypocritical, inconsistent AFL.

Kingy's going around calling for 5 week bans if players get a tackle slightly wrong, yet thinks this is brilliant - lol.

Also this stat was first mentioned by Daniel Hoyne last week so its something that has been fed to Kingy from Champion Data yet again.
 
Last edited:

Remove this Banner Ad

Analysis Season 2024 - Statistics and Analytics Thread

Remove this Banner Ad

Back
Top