Analysis Season 2023 - Statistics and Analytics Thread

Remove this Banner Ad

Status
Not open for further replies.
Without having much more then those stats to back it up (and a little tangent) I've always felt in soccer teams are most likely to score either directly after half time (energy is up after a good break) or right at the death (red time).

I wonder if you made a "green time" and defined it as the first 5mins of a quarter, if the majority of scores would be within that and red time. It's not uncommon to see a flurry of scores early, a big arm wrestle through the middle, then a flurry of goals at the end as a quarter plays out.

Unless your team is manchester united, who invite the opposition to score at all times (yes I'm cranky I woke up at 5am to watch that corrupt, evil organisation again).
 
Some points from this week's pure footy show relevant to the prelim:

  • Carlton's entries into forward 50 have been as bad as Melbourne's across the first two finals games, but they've got away with it. I expect Curnow to get far more targets in this game (they've only given him 3 genuine looks at it per Champion Data's estimation across 2 games).
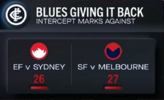
  • Carlton are conceding a ridiculous amount of intercept marks against:

1695251709553.png


  • Carlton's 'core four' profile (don't ask me what each category is based on because I don't remember):

1695251778068.png

  • Weitering has had 3+ intercept marks for 15 straight games - neutralising him will be critical (duh)

Our core 4 profile:

1695251889371.png


  • The with the footy profile is based on us being #1 in turning possession into a score, and #1 in transitioning the ball form D50 to F50
 

Log in to remove this ad.

Validates what the eye has seen in Carlton’s first two finals. Their opponents couldn’t manage to hurt them the other way. Coming up against two teams with no competent tall forwards was a blessing for them. Felt like Sydney and Melbourne suffered from the same issues.
 
Without having much more then those stats to back it up (and a little tangent) I've always felt in soccer teams are most likely to score either directly after half time (energy is up after a good break) or right at the death (red time).

I wonder if you made a "green time" and defined it as the first 5mins of a quarter, if the majority of scores would be within that and red time. It's not uncommon to see a flurry of scores early, a big arm wrestle through the middle, then a flurry of goals at the end as a quarter plays out.
Turns out, no. Scoring is, if anything, marginally more prolific in the middle of a quarter.

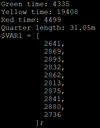
Over the last three seasons green time has accounted for 4335 scores, red time for 4499, but yellow time for 19408 (on a recorded length of 31.05mins/quarter, this is a little higher than you'd expect if scoring was steady across a quarter).

I've also binned the scores per quarter into the first, second, third, ... tenth decile of a quarter, which you can also see below, with the first and last 10% of quarters being the least prolific periods for scoring.
putty_zlAzYSWcn1.png

Roughly I'd guess this is because there are often a lot of stoppages early in quarters, and a lot of control-play towards the ends of them.
 
Turns out, no. Scoring is, if anything, marginally more prolific in the middle of a quarter.

Over the last three seasons green time has accounted for 4335 scores, red time for 4499, but yellow time for 19408 (on a recorded length of 31.05mins/quarter, this is a little higher than you'd expect if scoring was steady across a quarter).

I've also binned the scores per quarter into the first, second, third, ... tenth decile of a quarter, which you can also see below, with the first and last 10% of quarters being the least prolific periods for scoring.
View attachment 1809829

Roughly I'd guess this is because there are often a lot of stoppages early in quarters, and a lot of control-play towards the ends of them.
Holy shit you actually did it haha. Glad to be proven wrong! Did you / people consider red time to be the last literal 5 mins of a quarter? Or the last 5 mins of playing time?

Basically I'm just trying to pick this apart cause it's blown my concept completely out of the water haha.

Edit: Wait just reread the post again and you explain is pretty clearly.
 
Holy s**t you actually did it haha. Glad to be proven wrong! Did you / people consider red time to be the last literal 5 mins of a quarter? Or the last 5 mins of playing time?

Basically I'm just trying to pick this apart cause it's blown my concept completely out of the water haha.

Edit: Wait just reread the post again and you explain is pretty clearly.
Hmmmm I've always interpreted red time as that period after 20 minutes in the quarter (ie time on). It comes from the old scoreboards at country footy grounds which show a clock face, with the part beyond 20 minutes (originally 25 minutes) coloured red.

I think the phrase got corrupted during the Channel 10 days when they removed the countdown clock with 5 minutes to play.
I've always interpreted it the same way for the same reason. last 5-10 mins of each qtr.
 
Hmmmm I've always interpreted red time as that period after 20 minutes in the quarter (ie time on). It comes from the old scoreboards at country footy grounds which show a clock face, with the part beyond 20 minutes (originally 25 minutes) coloured red.

I think the phrase got corrupted during the Channel 10 days when they removed the countdown clock with 5 minutes to play.
Yeah I'm definitely one of the ones that was corrupted by channel 10. But if it's just additional time in a quarter that probably makes more sense.

Either way no matter how you slice it, from what Jivlain posted scoring doesn't spike in it as a general rule, so it's been a unique feature of this finals series.
 
Below stats for what it's worth
I would like to see one for the last 4 games as that's more relevant.
However, the 8-week period is better than the whole season.


Where the midfield is concerned, the Giants have no obvious weakness.

Midfield Stats (Since Round 19) CollingwoodBrisbaneCarltonGWS
Clearance diff-0.9+3.9+6.1+1.4
Hitouts to advantage diff+2.6-3.7-1.3+3.1
First possession to clearance percentage73.2%76.4%76.4%75.1%
Scores from stoppages diff+1.4+6.7+22.8+7.9
Average goals from stoppages 5.36.46.56.5
D50 to I50 % 16.3%29.6%18.2%20.3%
Midfield pressure rating diff+7-4+4+9
Midfield contested possession diff-7.1+9.4+12.0+5.3
Inside 50 diff-7.7+7.0+3.5+3.4
We seem to create a lot of turnover which you would generally think comes off pressure but we are not a great pressure team as far as the stats go.
We are a good ball movement team though
 
We seem to create a lot of turnover which you would generally think comes off pressure but we are not a great pressure team as far as the stats go.
We are a good ball movement team though

We don't create lots of turnover. When we do get turnovers though, we punish the opposition. From Richard little (former analyst at Essendon) on twitter:

1695346736065.png
 

(Log in to remove this ad.)

We don't create lots of turnover. When we do get turnovers though, we punish the opposition. From Richard little (former analyst at Essendon) on twitter:

View attachment 1810240
We have never been a particularly high tackle team.
Seems like they have just tried to pick something to pump up Carlton’s tyres.
 
We have never been a particularly high tackle team.
Seems like they have just tried to pick something to pump up Carlton’s tyres.

AFL.com.au maybe, Richard Little posts the same graphics for every game all year so he's not pumping anyone up.

The relevant point, discussed way earlier in this thread, is that our games tend to be lower pressure in general because we are such a direct team and our kick to handball ratio is nearly 2 to 1.

We actually have the second highest pressure act differential over our opponenets across the season and the opposition averages the lowest pressure acts against us in the comp. As you say, we've never been a high tackle team.

The Champion data definition of 'pressure' has a use but I think any differential that is '-4' is meaningless unless they show us the full range - i.e. does a 4 point lower pressure rating mean anything or is it a trivial difference?

I just keep coming back to how many turnovers Carlton has averaged (6th highest) across the season and the fact they gave melbourne 80ish turnovers last week and can't see how we don't kick a winning score.
 
Last edited:
Was just looking at some numbers and I find this one the most incredulous given that it would be the first time in we’ll over decade that as a club we are in the positive.

At the present time our win / loss record as the Brisbane Lions since round 1 in 1997 to PF in 2023 is:

Played = 622 games
Won = 308
Lost = 308
Drawn = 6
Percentage = 50%
For = 8,334 goals. 7,515 behinds. 57,519 total
Against = 8,323 goals. 7,348 behinds. 57,286 total
Point Differential = +233

C’mon Lions, get ahead of the win / loss and get our 12th premiership.
We’ve been a bit inaccurate with a lead of 11.167.233 😳
 
The last post from the purefooty show this year:


1695860594079.png

  • As an explainer, the above is showing how often the premier won each stat
  • After this weekend, 18 of the last 19 premiers are going to finish top 3 in points from turnover differential (both us and Collingwood are in the top 3).

Why collingwood could win:

1695861233172.png

  • Note, 'half back' refers to the area between the 50m line and the centre circle - no team is more damaging than Collingwood than turning their possession there into a score.
  • 26% of their score being from half back is the 4th highest percentage ever recorded since Champion Data invented stats (23 years since they started)

Why Collingwood could be vulnerable:

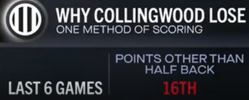
1695861490429.png

  • Their other methods of scoring (forward half, centre bounce, stoppage etc) have really fallen off
  • They've only kicked 4 goals in the finals series from forward half work - i.e. winning the ball back in the forward half or through f50 stoppages
  • 15 of their 17 goals this finals series have come from in the corridor
Why we can win:

1695861728602.png
  • As said above in the last 10 years the premier has won the turnover game on grand final day
  • We are the 7th team ranked 1st in points from turnovers and points against from turnovers since Champion Data started tracking it.
  • Of the previous 6, 4 have won the flag (including Geelong last year), and the two that didn't were pretty freak results in Geelong in 08 and Richmond losing the prelim in 2018.
Where we could be vulnerable:

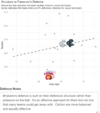
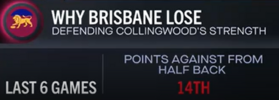
1695861951088.png

  • We have given a chance to teams to score from their half back area in the last 5 games
  • Outside of this area of score source, we are the 5th hardest to score against.
And finally on Dunkley's lockdown matchups this year:

1695862139278.png


  • Poor spelling of Jordan Dawson aside, the graphic shows how Dunks has locked down on Cripps twice and Dawson, two bigger midfielders.
  • The Rozee one is an interesting comparison (its his performance in the qualifying final) - he's more agile than the others.
  • With De Goey, he has size and power but also some agility so he's a match up in between
  • Dunks has only had 12 of his tackles completely broken this year (less than 1 every 2 weeks). De Goey broke 4 tackles alone on the weekend.
  • If you can find it, its worth looking at the David King and Leigh Montagna segment on AFL360 last night looking at how the Giants 'tried' to defend De Goey. There was minimal body work and they allowed him free run through stoppage, something that Dunks can't (and won't) allow him to do.
 
The last post from the purefooty show this year:


View attachment 1815943

  • As an explainer, the above is showing how often the premier won each stat
  • After this weekend, 18 of the last 19 premiers are going to finish top 3 in points from turnover differential (both us and Collingwood are in the top 3).

Why collingwood could win:

View attachment 1815947

  • Note, 'half back' refers to the area between the 50m line and the centre circle - no team is more damaging than Collingwood than turning their possession there into a score.
  • 26% of their score being from half back is the 4th highest percentage ever recorded since Champion Data invented stats (23 years since they started)

Why Collingwood could be vulnerable:

View attachment 1815952

  • Their other methods of scoring (forward half, centre bounce, stoppage etc) have really fallen off
  • They've only kicked 4 goals in the finals series from forward half work - i.e. winning the ball back in the forward half or through f50 stoppages
  • 15 of their 17 goals this finals series have come from in the corridor
Why we can win:

View attachment 1815959
  • As said above in the last 10 years the premier has won the turnover game on grand final day
  • We are the 7th team ranked 1st in points from turnovers and points against from turnovers since Champion Data started tracking it.
  • Of the previous 6, 4 have won the flag (including Geelong last year), and the two that didn't were pretty freak results in Geelong in 08 and Richmond losing the prelim in 2018.
Where we could be vulnerable:

View attachment 1815963

  • We have given a chance to teams to score from their half back area in the last 5 games
  • Outside of this area of score source, we are the 5th hardest to score against.
And finally on Dunkley's lockdown matchups this year:

View attachment 1815969


  • Poor spelling of Jordan Dawson aside, the graphic shows how Dunks has locked down on Cripps twice and Dawson, two bigger midfielders.
  • The Rozee one is an interesting comparison (its his performance in the qualifying final) - he's more agile than the others.
  • With De Goey, he has size and power but also some agility so he's a match up in between
  • Dunks has only had 12 of his tackles completely broken this year (less than 1 every 2 weeks). De Goey broke 4 tackles alone on the weekend.
  • If you can find it, its worth looking at the David King and Leigh Montagna segment on AFL360 last night looking at how the Giants 'tried' to defend De Goey. There was minimal body work and they allowed him free run through stoppage, something that Dunks can't (and won't) allow him to do.

Bodes really well for us if we can stop back half scoring.
 
The last post from the purefooty show this year:


View attachment 1815943

  • As an explainer, the above is showing how often the premier won each stat
  • After this weekend, 18 of the last 19 premiers are going to finish top 3 in points from turnover differential (both us and Collingwood are in the top 3).

Why collingwood could win:

View attachment 1815947

  • Note, 'half back' refers to the area between the 50m line and the centre circle - no team is more damaging than Collingwood than turning their possession there into a score.
  • 26% of their score being from half back is the 4th highest percentage ever recorded since Champion Data invented stats (23 years since they started)

Why Collingwood could be vulnerable:

View attachment 1815952

  • Their other methods of scoring (forward half, centre bounce, stoppage etc) have really fallen off
  • They've only kicked 4 goals in the finals series from forward half work - i.e. winning the ball back in the forward half or through f50 stoppages
  • 15 of their 17 goals this finals series have come from in the corridor
Why we can win:

View attachment 1815959
  • As said above in the last 10 years the premier has won the turnover game on grand final day
  • We are the 7th team ranked 1st in points from turnovers and points against from turnovers since Champion Data started tracking it.
  • Of the previous 6, 4 have won the flag (including Geelong last year), and the two that didn't were pretty freak results in Geelong in 08 and Richmond losing the prelim in 2018.
Where we could be vulnerable:

View attachment 1815963

  • We have given a chance to teams to score from their half back area in the last 5 games
  • Outside of this area of score source, we are the 5th hardest to score against.
And finally on Dunkley's lockdown matchups this year:

View attachment 1815969


  • Poor spelling of Jordan Dawson aside, the graphic shows how Dunks has locked down on Cripps twice and Dawson, two bigger midfielders.
  • The Rozee one is an interesting comparison (its his performance in the qualifying final) - he's more agile than the others.
  • With De Goey, he has size and power but also some agility so he's a match up in between
  • Dunks has only had 12 of his tackles completely broken this year (less than 1 every 2 weeks). De Goey broke 4 tackles alone on the weekend.
  • If you can find it, its worth looking at the David King and Leigh Montagna segment on AFL360 last night looking at how the Giants 'tried' to defend De Goey. There was minimal body work and they allowed him free run through stoppage, something that Dunks can't (and won't) allow him to do.

What is interesting is that we scored 6 of our 11 goals in the first half after launches from the back back in round 4. In round 23, 11 of Collingwood's 15 goals were from stoppage, and 13 of our 19 goals were from turnovers (Collingwood at 4).

We've shown we can score from multiple avenues against Collingwood this season. That flexibility of score sources will be important as there's only so much you can game plan against.
 
The last post from the purefooty show this year:


View attachment 1815943

  • As an explainer, the above is showing how often the premier won each stat
  • After this weekend, 18 of the last 19 premiers are going to finish top 3 in points from turnover differential (both us and Collingwood are in the top 3).

Why collingwood could win:

View attachment 1815947

  • Note, 'half back' refers to the area between the 50m line and the centre circle - no team is more damaging than Collingwood than turning their possession there into a score.
  • 26% of their score being from half back is the 4th highest percentage ever recorded since Champion Data invented stats (23 years since they started)

Why Collingwood could be vulnerable:

View attachment 1815952

  • Their other methods of scoring (forward half, centre bounce, stoppage etc) have really fallen off
  • They've only kicked 4 goals in the finals series from forward half work - i.e. winning the ball back in the forward half or through f50 stoppages
  • 15 of their 17 goals this finals series have come from in the corridor
Why we can win:

View attachment 1815959
  • As said above in the last 10 years the premier has won the turnover game on grand final day
  • We are the 7th team ranked 1st in points from turnovers and points against from turnovers since Champion Data started tracking it.
  • Of the previous 6, 4 have won the flag (including Geelong last year), and the two that didn't were pretty freak results in Geelong in 08 and Richmond losing the prelim in 2018.
Where we could be vulnerable:

View attachment 1815963

  • We have given a chance to teams to score from their half back area in the last 5 games
  • Outside of this area of score source, we are the 5th hardest to score against.
And finally on Dunkley's lockdown matchups this year:

View attachment 1815969


  • Poor spelling of Jordan Dawson aside, the graphic shows how Dunks has locked down on Cripps twice and Dawson, two bigger midfielders.
  • The Rozee one is an interesting comparison (its his performance in the qualifying final) - he's more agile than the others.
  • With De Goey, he has size and power but also some agility so he's a match up in between
  • Dunks has only had 12 of his tackles completely broken this year (less than 1 every 2 weeks). De Goey broke 4 tackles alone on the weekend.
  • If you can find it, its worth looking at the David King and Leigh Montagna segment on AFL360 last night looking at how the Giants 'tried' to defend De Goey. There was minimal body work and they allowed him free run through stoppage, something that Dunks can't (and won't) allow him to do.
Great stuff, thanks for sharing. What I found more interesting from Joey's segment last night was his stats about Collingwood playing in bursts, which I've touched on several times this year.

Basically they are scoring half their goals in the space of a quarter, it's just a question of when that "quarter" is.

I think it's a little bit more nuanced than this... Joey highlighted the 5 goals in the 3rd quarter against the Giants, but I thought it was their start to that game which was more intense and intimidating. The main difference was the Giants' defence was also excellent during that period.

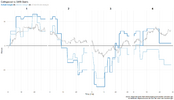
You can see as much from Richard Little's chart here below, showing the margin (dark blue), margin via expected score (light blue) and my personal favourite, margin via expected score chain. This is where it plots your expected score based on where you start your possession chain. Thus, forcing turnovers or stoppages closer to goal gives you a higher expected score. It's a good guide to territory dominance during a game.

20230928_133433.png

Either way, Collingwood play in bursts, have for most of the season, and what we've been able to do well has been to interrupt those bursts.

In Round 4 Collingwood kicked 3 goals to end the first quarter. To be honest we were lucky quarter time came when it did in that game, but after that we kicked the next 10 goals. Then when they came at us for the last quarter and a half we were repeatedly able to pick them off with answering goals on the counter, breaking up whatever momentum they were building.

Then in Round 23, they kicked 3 in a row in the middle of the first and 4 in a row in the middle of the third after we'd built a good lead. Both times we responded really well.

So Collingwood generally have about two "bursts" in them each game, perhaps one more profitable on the scoreboard than the other. The challenge for us will be to identify this quickly, halt their momentum as soon as possible, and make the most of our opportunities when we have the ascendancy in general play.
 
Status
Not open for further replies.

Remove this Banner Ad

Remove this Banner Ad

Back
Top