Analysis The Stats and nothing but the Stats

Remove this Banner Ad

I wondered if the stat reflects how we use the player, rather than how good or bad they are?

That’ll definitely be a part of it, since it’s weighted with what you’d expect from the average player taking that same kick.

So a player that is used to take conservative outlet kicks in the d50, and hits them at about the average rate would have threat and retention ratings of about 0.

Conversely, a player that is used to deliver the ball inside 50, and finds a dangerous target at about the average rate for that kick, would also have a threat and retention rating of about 0.

So it’s also useful to look at the xThreat/kick and xRetention/kick columns.
Generally defenders will be taking kicks with lower xThreat and higher xRetention values.

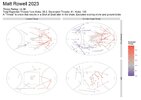
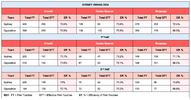
And you’ll see in the 2nd chart, for instances, that McGovern and May have relatively low expected threat and restively high expected retention ratings for most of their kicks - ie: they’re outlet kicks in defence.

BUT they hit those outlet kicks a lot more often than the average key defender, and their outlet kicks are much more likely to find a target that ends up in a scoring chain (so they’re picking good options).

On the other side of things - Jake Stringer takes a lot of kicks with a high xThreat (since he’s kicking inside 50), and they usually find a teammate (so he’s got a good retention rating), but they’re somehow much less likely than you’d expect to lead to scores (so he’s picking bad options) - hence the negative threat rating. So he reliably finds the wrong target.

Who’s the ‘better’ kick in the situation? I dunno. But everyone has a role, and if they’re performing that role worse than average, then you’ve got a problem, because it suggests someone else could be doing that job better:

ie: for us, McCartin and Fox are turnover merchants on safe kicks, and should be handing the ball off whenever possible - and thankfully, they do!

Conversely, Ollie Florent is having a bit of a mare by foot, picking below average options and turning it over more than he should - but he’s taken somewhere in the top 50 most kicks in the league this season. He should hand it off more.
 
Last edited:
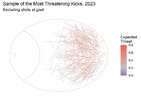
A statistician over on Twitter has developed a metric for judging the best field kicks in the league.
Basically it works a bit like gymnastic/diving judging - he looks at the degree of difficulty of their kicks, and how often they successfully execute them.

Guys that generate regularly generate scoring opportunities from tough parts of the ground (or when under pressure) and who don’t the ball over, will score well.
An article with a more through explanation of the methodology is up on the ABC website, thanks to
friend-of-the-Bigfooty-Swans-board Sean Lawson: What makes a good kick?

Anyway, to the rankings


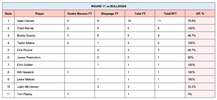
One Swan (along with Ed Richards) stands head and shoulders above the comp with how dangerous their kicking is, but it’s not who you might think.

View attachment 2011034

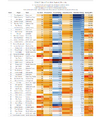
JMac turns the ball over slightly more than Zac Williams, but is much, much more damaging (Also very surprising is which Swan comes in at number 2!)


Then there is the top 50 most prolific kicks in the league, ranked by kick quality. A couple of more familiar names here - Gulden and Blakey - but they don’t appear on the first list due to their tendency to turn the ball over a bit. (But interestingly, their kicking is still apparently not as damaging as JMac’s, Jordon or Heeney’s.)

View attachment 2011035


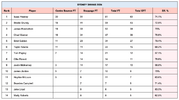
Finally, the team ranked.

View attachment 2011037

Lessons seem to be:
1) Get the ball in JMac’s hands more often
2) Jordon is a real surprise package given his kicking was his major weakness at the Demons
3) Gulden and Blakey are great kicks, but those occasional turnovers do hurt. But it’s their running as much as their kicking that makes them so dangerous.
3) Grundy should stick to handballing
I'd be very interested in the coaches take on this.
1) the first 5 kicking most often to uncontested situations?
2) efficiency does not equal retention.
3) unsurprised that backs' kicking mostly doesn't rate for threat but Adams, Hayward and Rowbottom? Plus Chad? Hmmmm 🤔
 
3) unsurprised that backs' kicking mostly doesn't rate for threat but Adams, Hayward and Rowbottom? Plus Chad? Hmmmm 🤔

I think you might be misunderstanding this bit?

It’s all weighted, so Adams, Hayward, Warner and Rowbottom are underperforming (relative to the AFL average) in terms of where/how they’re taking their kicks.

It’s not saying their kicks are less dangerous than Melicans and Lloyds in absolute terms.

Clearly a guy like Hayward that is usually kicking inside 50 is more immediately threatening than Melican. It’s just that this year, Hayward’s field kicks are leading to less scores than you’d expect them to, on average.

And remember, this is field kicking only, not shots at goal.
 

Log in to remove this ad.

My question wouldn't be what makes a good kick, but what makes a bad kick?

It's not always clear.

A centre bounce midfielder wins it and launches it deep inside 50. It hasn't led to a mark inside 50, nor was it to a forward's advantage. But it's taken the play from the centre square to a stoppage deep in our forward 50 in about 5 seconds. It's put the opposition defenders under pressure and it's led to the forward stoppage scenarios we thrive on with our pressure.

Is it a technically perfect kick? Not really. Does it work? Absolutely.
I suspect that this particular model would rate that kick pretty good

IMG_4221.jpeg

For instance, in the article, it spexifically discusses Matt Rowell as a player with a low traditional “kicking efficiency” stat (usually in the 50s%), but who is actually a pretty good kick given how and when he’s usually kicking it. Contested, pressure kicks that he usually gets to contests near goal where it isn’t turned over.

IMG_4222.jpeg

I think a pretty good rule of thumb with a lot of this stuff is if you can think of an immediate and obvious problem with the model, it’s probably been at least partially accounted for. Most of the guys doing this work are pretty canny.
 
I suspect that this particular model would rate that kick pretty good

View attachment 2011191

For instance, in the article, it spexifically discusses Matt Rowell as a player with a low traditional “kicking efficiency” stat (usually in the 50s%), but who is actually a pretty good kick given how and when he’s usually kicking it. Contested, pressure kicks that he usually gets to contests near goal where it isn’t turned over.

View attachment 2011192

I think a pretty good rule of thumb with a lot of this stuff is if you can think of an immediate and obvious problem with the model, it’s probably been at least partially accounted for. Most of the guys doing this work are pretty canny.
"Partially accounted for" is an apt description. It's still not the full picture as it describes a "threat" as a kick that results in a shot at goal later in the chain. But that's operating under the assumption that every kick's purpose is to be a part of a scoring chain. In an ideal world that is the case but in reality it's not. Some are kicks purely to relieve pressure (such as the long kick out of defence, the kick down the line, or the long bomb out of congestion), to set up plays that are advantageous to us (such as the example I mentioned of the bomb inside 50), to control possession with the explicit intention of not trying to score (such as late in quarters, games with a lead to protect).

And it, like all models relating to "efficiency", relies as much on the kicker as it does the receiver. Two players can do the exact same kick - let's say a long bomb into the forward line - and a tall teammate can mark it on one occasion, but then get beaten by his opponent on the other. One's had his kick listed as effective, the other listed as ineffective and a turnover.
 
"Partially accounted for" is an apt description. It's still not the full picture as it describes a "threat" as a kick that results in a shot at goal later in the chain. But that's operating under the assumption that every kick's purpose is to be a part of a scoring chain. In an ideal world that is the case but in reality it's not. Some are kicks purely to relieve pressure (such as the long kick out of defence, the kick down the line, or the long bomb out of congestion), to set up plays that are advantageous to us (such as the example I mentioned of the bomb inside 50), to control possession with the explicit intention of not trying to score (such as late in quarters, games with a lead to protect).

I mean, yeah, but that would be why it looks at both “threat” and “retention”.
Indeed, why most of the tables are organised by “retention” - goal number 1 is to keep possession of the football. Which is why a long kick to a contest, while technically ‘efficient’ by the old CD metric, is actually shit if it results in a turnover, and most teams now avoid them as much as possible (again, this is discussed in the article)

And if you look at, say, Tom McCartin, you can see he takes low expected threat kicks with a relatively high expected retention rate - ie: he’s going for safe kicks out of defence, which is fine, and primarily what you want your defenders to do.
But he still ****s them up a lot more than you’d expect for such safe kicks. He is a bad kick.
At least he’s not Sam Taylor, though.

IMG_4215.png
 
I mean, yeah, but that would be why it looks at both “threat” and “retention”.
Indeed, why most of the tables are organised by “retention” - goal number 1 is to keep possession of the football. Which is why a long kick to a contest, while technically ‘efficient’ by the old CD metric, is actually shit if it results in a turnover, and most teams now avoid them as much as possible (again, this is discussed in the article)

And if you look at, say, Tom McCartin, you can see he takes low expected threat kicks with a relatively high expected retention rate - ie: he’s going for safe kicks out of defence, which is fine, and primarily what you want your defenders to do.
But he still ****s them up a lot more than you’d expect for such safe kicks. He is a bad kick.
At least he’s not Sam Taylor, though.

View attachment 2011208
Yeah I've always found McCartin to be a very suspect kick. Kind of a "watch through your fingers" situation whenever he has the ball deep in defence LOL. But in some ways that makes him the quintessential Swans defender. I can remember watching Heath Grundy back in the day and thinking it was very possible no one ever actually taught him how to kick a football properly! (And we wouldn't have had him any other way)
 
I think a big thing to remember about kicking efficiency, retention, and damage is where the ball is going. We tend to forget that the kick can be perfect, but you also have to have people that can use that kick.

For example, when our pressure drops off, how kicking looks woeful. We kick, it gets turned over, and then the oppo runs to the other side and scores. Whereas, when all cylindars are firing we will still make shocking kicking decisions, but it turns into a contest that we're prepared for, and we can pressure win it back and score.

Often times, even at our best, there'll be 2-3 contests that you have to win in transition, and the more you win those the better your kicking looks.
 
That’ll definitely be a part of it, since it’s weighted with what you’d expect from the average player taking that same kick.

So a player that is used to take conservative outlet kicks in the d50, and hits them at about the average rate would have threat and retention ratings of about 0.

Conversely, a player that is used to deliver the ball inside 50, and finds a dangerous target at about the average rate for that kick, would also have a threat and retention rating of about 0.

So it’s also useful to look at the xThreat/kick and xRetention/kick columns.
Generally defenders will be taking kicks with lower xThreat and higher xRetention values.

And you’ll see in the 2nd chart, for instances, that McGovern and May have relatively low expected threat and restively high expected retention ratings for most of their kicks - ie: they’re outlet kicks in defence.

BUT they hit those outlet kicks a lot more often than the average key defender, and their outlet kicks are much more likely to find a target that ends up in a scoring chain (so they’re picking good options).

On the other side of things - Jake Stringer takes a lot of kicks with a high xThreat (since he’s kicking inside 50), and they usually find a teammate (so he’s got a good retention rating), but they’re somehow much less likely than you’d expect to lead to scores (so he’s picking bad options) - hence the negative threat rating. So he reliably finds the wrong target.

Who’s the ‘better’ kick in the situation? I dunno. But everyone has a role, and if they’re performing that role worse than average, then you’ve got a problem, because it suggests someone else could be doing that job better:

ie: for us, McCartin and Fox are turnover merchants on safe kicks, and should be handing the ball off whenever possible - and thankfully, they do!

Conversely, Ollie Florent is having a bit of a mare by foot, picking below average options and turning it over more than he should - but he’s taken somewhere in the top 50 most kicks in the league this season. He should hand it off more.
Brilliant! Thanks so very much!
 

(Log in to remove this ad.)

Interesting stat from CD about the use of Gulden at centre bounces


From those 105 attendances, Gulden has extracted the ball out of the centre just nine times.

“When he’s in the centre bounces, they are -28 clearances, that is the worst return of any player in the competition,” Hoyne said.

“Replace him with someone else that be more impactful, potentially Tom Papley.”
 
Interesting stat from CD about the use of Gulden at centre bounces

I think I heard Gulden saying that he tries to play to his strengths and improve on them rather than improving in areas he's no good at. Maybe he just lets extractors like Rowbottom, Heeney and Taylor feed the ball to him because he knows he'd suck at it and knows he's more useful to the team with his decision making and dangerous kicking.
 
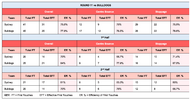
Did a summary of the year so far, from rounds 1-11, in first possession numbers.

Team Stats

Screen Shot 2024-06-07 at 1.51.52 pm.png

To be quite honest, unless there is any vociferous objections, I'm almost thinking of not bothering to do the team numbers for the rest of the year. They're just too piss-takingly similar to be able to take anything from them. I mean, maaaaybe the above suggests our superiority in the first possession aspect lies at stoppages? I guess? But geez, there really isn't much difference in the games and, evidently, across the season, to make this exercise worthwhile.

The only caveat to this reservation is that maybe it's just our team that has such little variable differences in the figures. Maybe other games with more weaker or dominant midfields than ours don't just break even, but have very disparate numbers that make for more interesting reading.

So, not sure.

Individual Stats

Screen Shot 2024-06-07 at 1.52.14 pm.png


The individual numbers are far more interesting, and maybe if I do away with the team numbers, I could focus on a few more specific individual categories.

I focused just on players that are relevant to the midfield here, either by sheer number of first possessions won (Florent) or their proximity to/prospects of being in, the midfield.

I thought I'd look at each of the core five players that run through our midfield and see what we can gleam from their numbers.

1. Heeney - He is top in each category, which is no small feat. Most first touches at centre bounces, most first touches at stoppages, most effective first touches. Interestingly he's actually behind all three of the other mids in terms of efficiency with those first touches, at 74.1%, but considering he's the mid who has copped the most opposition attention this year, that arguably makes his efficiency rating even more impressive. Of the core five, Heeney also has the highest percentage of first touches won at centre bounces (37%) and the highest percentage of first touches per CBA (13.3%.) He really has become the most JPK-adjacent mid we've had since the great man himself.

2. Grundy - It's funny, when I think about Brodie Grundy I think about him taking it out of the centre circle and getting it forward. But his percentage of first touches won at centre bounces (30.5%) is the second-lowest of anyone on the above table, and he also has the second-lowest percentage of first touches per CBA (7.4%) of anyone on the above table. For perspective, McLean, who is clearly the second option of the two, is going at 45.5% and 8.3% in those two categories. The two reasons I would guess for this would be: A) he seems to have a way of either drawing or giving away free kicks, particularly out of the middle, which skews the number of chances he gets to have first possessions there, or B) centre bounces tend to favour the more dominant "tap" rucks (your Max Gawn, Jarrod Witts types) whereas in stoppages Grundy can really just activate that big-bodied midfielder mode in the contest. It could be both explanations, or it could be neither.

3. Rowbottom - He's just so bloody good. With his tackling and pressure, it's obvious he is clearly the most important player in terms of compromising the other team's efficiency. Our opposition teams this year have had an average of 10.5 ineffective first possessions per game. I would hazard a guess that it's Rowbottom who is responsible for the majority of them. On top of this, is the damage he's doing in the middle of the ground. He still manages to get the second-most first touches at centre bounces for us, which is even more impressive when you consider that centre bounces typically favour the highly-attacking mids (your Horne-Francis, Rankine, Petracca types.) He's got a higher efficiency than Heeney with his first touches (75%) and has the second-highest percentage of first touches won at centre bounces (36.5%.) Such a gun.

4. Warner - When I did this summary table at the previous bye in round 5, Warner was in fifth place on the list, behind Gulden. Those two have now swapped places as Warner's become more and more dominant. Like Grundy, Warner's numbers are probably skewed a little by the style in which he plays, as more of a receiver taking it to the outside. It means he's more likely to be the second or third link in the chain, rather than the first. So he's fairing pretty well taking that into account.

5. Gulden - I was keen to see how his numbers emerged, given the recent hoopla about his role in the midfield, particularly in regards to centre bounces. Whilst I don't track the efficiency of the individuals' first touches at centre bounces or stoppages (this is one such category I could focus more on if I didn't bother with the team numbers), Gulden has an overall first touch efficiency of 79.4%. It's the highest efficiency than any of the other core five, and the second-highest of anyone on the above table. So, yeah.

And a few tidbits for some of the others...

- Adams has both the highest percentage of first touches won at centre bounces (a whopping 50% - for perspective, Heeney's was 37%), and the highest percentage of first touches per CBA (a whopping 20.8% - for perspective, Heeney's was 13.3%) So there may be some merit to the idea that Adams & Grundy's cohesion from their Collingwood days has carried over, after all.

- Lllllllloooooyyyyddd has the highest efficiency from his first touches of anyone on the table, at 83.3%, the only one to register an efficiency above 80%. Not saying we should play him in the mids, as the ship has sailed, but I agree with (insert name of poster I can't remember now) who said that Lloyd could've been a Nick Daicos type mid. He has that slippery quality that's hard to tackle.

- McInerney isn't quite a natural at the whole 'roving' thing just yet. As well as having the second-lowest efficiency from his first touches, he also has the lowest percentage of first touches won at centre bounces (17.6%), and the lowest percentage of first touches per CBA (5.7%.) Probably needs to be a bit cleaner and stronger if he wants more inside time, but it's hardly his bread & butter, so no big deal.

- As for hOyNe's suggestion that we try Papley at centre bounces instead of Gulden, I don't know if that would make much of a difference. Papley's 22% less efficient with his first touches than Gulden, and whilst he does have a better percentage of first touches per CBA than Gulden, it's only 2% better, so not sure it's a disparity that's worth upsetting the applecart over.

Sorry for the lengthy post. Won't be doing another one of these til the end of the year. Would appreciate the feedback on the team numbers as well. I personally could give or take them but if anyone finds them illuminating then I'm happy to continue with it.
 
Did a summary of the year so far, from rounds 1-11, in first possession numbers.

Team Stats

View attachment 2012954

To be quite honest, unless there is any vociferous objections, I'm almost thinking of not bothering to do the team numbers for the rest of the year. They're just too piss-takingly similar to be able to take anything from them. I mean, maaaaybe the above suggests our superiority in the first possession aspect lies at stoppages? I guess? But geez, there really isn't much difference in the games and, evidently, across the season, to make this exercise worthwhile.

The only caveat to this reservation is that maybe it's just our team that has such little variable differences in the figures. Maybe other games with more weaker or dominant midfields than ours don't just break even, but have very disparate numbers that make for more interesting reading.

So, not sure.

Individual Stats

View attachment 2012955


The individual numbers are far more interesting, and maybe if I do away with the team numbers, I could focus on a few more specific individual categories.

I focused just on players that are relevant to the midfield here, either by sheer number of first possessions won (Florent) or their proximity to/prospects of being in, the midfield.

I thought I'd look at each of the core five players that run through our midfield and see what we can gleam from their numbers.

1. Heeney - He is top in each category, which is no small feat. Most first touches at centre bounces, most first touches at stoppages, most effective first touches. Interestingly he's actually behind all three of the other mids in terms of efficiency with those first touches, at 74.1%, but considering he's the mid who has copped the most opposition attention this year, that arguably makes his efficiency rating even more impressive. Of the core five, Heeney also has the highest percentage of first touches won at centre bounces (37%) and the highest percentage of first touches per CBA (13.3%.) He really has become the most JPK-adjacent mid we've had since the great man himself.

2. Grundy - It's funny, when I think about Brodie Grundy I think about him taking it out of the centre circle and getting it forward. But his percentage of first touches won at centre bounces (30.5%) is the second-lowest of anyone on the above table, and he also has the second-lowest percentage of first touches per CBA (7.4%) of anyone on the above table. For perspective, McLean, who is clearly the second option of the two, is going at 45.5% and 8.3% in those two categories. The two reasons I would guess for this would be: A) he seems to have a way of either drawing or giving away free kicks, particularly out of the middle, which skews the number of chances he gets to have first possessions there, or B) centre bounces tend to favour the more dominant "tap" rucks (your Max Gawn, Jarrod Witts types) whereas in stoppages Grundy can really just activate that big-bodied midfielder mode in the contest. It could be both explanations, or it could be neither.

3. Rowbottom - He's just so bloody good. With his tackling and pressure, it's obvious he is clearly the most important player in terms of compromising the other team's efficiency. Our opposition teams this year have had an average of 10.5 ineffective first possessions per game. I would hazard a guess that it's Rowbottom who is responsible for the majority of them. On top of this, is the damage he's doing in the middle of the ground. He still manages to get the second-most first touches at centre bounces for us, which is even more impressive when you consider that centre bounces typically favour the highly-attacking mids (your Horne-Francis, Rankine, Petracca types.) He's got a higher efficiency than Heeney with his first touches (75%) and has the second-highest percentage of first touches won at centre bounces (36.5%.) Such a gun.

4. Warner - When I did this summary table at the previous bye in round 5, Warner was in fifth place on the list, behind Gulden. Those two have now swapped places as Warner's become more and more dominant. Like Grundy, Warner's numbers are probably skewed a little by the style in which he plays, as more of a receiver taking it to the outside. It means he's more likely to be the second or third link in the chain, rather than the first. So he's fairing pretty well taking that into account.

5. Gulden - I was keen to see how his numbers emerged, given the recent hoopla about his role in the midfield, particularly in regards to centre bounces. Whilst I don't track the efficiency of the individuals' first touches at centre bounces or stoppages (this is one such category I could focus more on if I didn't bother with the team numbers), Gulden has an overall first touch efficiency of 79.4%. It's the highest efficiency than any of the other core five, and the second-highest of anyone on the above table. So, yeah.

And a few tidbits for some of the others...

- Adams has both the highest percentage of first touches won at centre bounces (a whopping 50% - for perspective, Heeney's was 37%), and the highest percentage of first touches per CBA (a whopping 20.8% - for perspective, Heeney's was 13.3%) So there may be some merit to the idea that Adams & Grundy's cohesion from their Collingwood days has carried over, after all.

- Lllllllloooooyyyyddd has the highest efficiency from his first touches of anyone on the table, at 83.3%, the only one to register an efficiency above 80%. Not saying we should play him in the mids, as the ship has sailed, but I agree with (insert name of poster I can't remember now) who said that Lloyd could've been a Nick Daicos type mid. He has that slippery quality that's hard to tackle.

- McInerney isn't quite a natural at the whole 'roving' thing just yet. As well as having the second-lowest efficiency from his first touches, he also has the lowest percentage of first touches won at centre bounces (17.6%), and the lowest percentage of first touches per CBA (5.7%.) Probably needs to be a bit cleaner and stronger if he wants more inside time, but it's hardly his bread & butter, so no big deal.

- As for hOyNe's suggestion that we try Papley at centre bounces instead of Gulden, I don't know if that would make much of a difference. Papley's 22% less efficient with his first touches than Gulden, and whilst he does have a better percentage of first touches per CBA than Gulden, it's only 2% better, so not sure it's a disparity that's worth upsetting the applecart over.

Sorry for the lengthy post. Won't be doing another one of these til the end of the year. Would appreciate the feedback on the team numbers as well. I personally could give or take them but if anyone finds them illuminating then I'm happy to continue with it.
You're right. The patterns appear pretty consistent so I would only go back to it if Parker is inserted to see if that changes things.
Thanks again for the effort. It has been very enlightening.
 

Remove this Banner Ad

Analysis The Stats and nothing but the Stats

Remove this Banner Ad

Back
Top